
Roads

-
Road Network Length
6,331,791 km
-
Road Infrastructure Quality
4.5
-
Number of PPPs Reaching FC
518
-
Value of PPPs Reaching FC
98,928 M
-
Number of PPPs with Foreign Sponsors
63
-
Number of PPPs with Govt. Support
309
FC = financial closure, Govt. = government, km = kilometers, M = million.
Note: Quality of road infrastructure: 1 (lowest) – 7 (highest).
Source: Government of India, Ministry of Road Transport and Highways. 2022. Year End Review (accessed 9 September 2023).
Roads
Contracting Agencies
The Ministry of Road Transport and Highways (MORTH) is the responsible federal government entity for the road and highway sector. The key agencies responsible for developing highways are the National Highways Authority of India (NHAI) and the National Highways and Infrastructure Development Corporation Limited (NHIDCL).
- NHAI, which is under the MORTH, is responsible for planning and procurement of national highways in the country. The NHAI is mandated to implement by phase the National Highways Development Project (NHDP), which is India’s largest ever highway project. Its main mandate is to develop the arterial roads of the country for interstate movements of goods and passengers. These roads would traverse the length and width of the country, connecting the national and state capitals, major ports, and rail junctions. The NHAI is the lead agency for managing public–private partnership (PPP) contracts. It has also formed a special purpose vehicle (SPV) for funding road projects.1
- The NHIDCL is a fully owned company of the MORTH. The company promotes, surveys, establishes, designs, builds, operates, maintains, and upgrades national highways and strategic roads, including interconnecting roads that share international boundaries with neighboring countries.2
- The Border Roads Organization develops and maintains the road networks in India’s border areas and friendly neighboring countries.
The Ministry of Rural Development is responsible for rural roads along with the following agencies:
- The Public Works Department and other road corporations govern and manage state highways and major district roads.
- Rural roads are developed, maintained, and monitored by the Ministry of Rural Development.
- Project roads for irrigation, power, and mines are governed and managed by state public works departments and project organizations.
- Urban roads for intracity networking are governed by municipal corporations.
- Village roads are being governed by the respective zila-parishads (district councils) and state governments.
- 1Government of India, National Highways Authority of India. About NHAI.
- 2Government of India, MORTH, National Highways and Infrastructure Development Corporation Limited. Welcome to NHIDCL.
Roads
Sector Laws and Regulations
The main regulations governing the roads and highways sector in India are summarized in the table.
Key Regulations
Act Description The National Highways Act, 1956 Provides for the declaration of certain highways to be national highways and for matters connected therewith. The Motor Vehicles Act, 1988 Consolidates and amends laws relating to motor vehicles. The National Highways Authority of India Act, 1988 Provides for the constitution of an authority for the development, maintenance, and management of national highways and for matters connected therewith or incidental thereto. The Central Road and Infrastructure Fund Act, 2000 Gives statutory status to the Central Road Fund, governed by the Resolution of Parliament passed in 1988, for the development and maintenance of national highways and improvement of safety at railway crossings and, for these purposes, to levy and collect by way of cess (tax or levy), a duty of excise and duty of customs on motor spirit commonly known as petrol, high-speed diesel oil, and for other matters connected therewith. The Control of National Highways (Land and Traffic) Act, 2002 Provides for control of land within the national highways, right-of-way, and traffic moving on the national highways, and for removal of unauthorized occupation thereon. The Carriage by Road Act, 2007 Provides for the regulation of common carriers, limiting their liability and declaration of value of goods delivered to them to determine their liability for loss of, or damage to, such goods occasioned by the negligence or criminal acts of themselves, their servants or agents, and for matters connected therewith or incidental thereto. National Highways Fee (Determination of Rates and Collection) Rules, 2008 and subsequent amendments of 2008, 2010, 2011, 2013, 2014, 2015, 2016, 2017, 2018, 2019, and 2022 Defines and regulates the toll tariff framework for use of any section of national highway, permanent bridge, bypass or tunnel forming part of the national highway, as the case may be, in accordance with the provisions of the rules. Sources: Government of India, Ministry of Road Transport and Highways (MORTH). Acts / Rules; Government of India, MORTH. 2000. Central Road and Infrastructure Fund Act; and Government of India, MORTH. 2008. National Highways Fee Rules, 2008; and Government of India. National Highways Authority of India.
The commonly applied regulations for developing national highways are as follows:
- A list of operational standards for road design;
- The National Road Safety Policy, which outlines the policy initiatives to be implemented by the government at all levels to improve the road safety activities in the country;
- Notifications and rules of the MORTH and the NHAI; and
- The Indian Road Congress, which was set up by the Government of India in December 1934, in consultation with state governments, to provide a regular national forum for pooling experience and ideas on all matters concerned with planning, design construction, and maintenance of highways.
Foreign Investment Restrictions
COMPAREDOWNLOADParameter 2021 2022 2023 Maximum allowed foreign ownership of equity in greenfield projects 100% 100% 100% LEARN MORERoads
Sector Laws and Regulations
The maximum equity investment allowed for foreign investors in greenfield projects is 100% through the automatic route.
Standard Contracts
COMPAREDOWNLOADType of Contract Availability PPP/concession agreement Performance-based operation and maintenance contract Engineering, procurement, and construction contract - Yes
In addition to traditional models, the MORTH initiated two new models in recent years: (i) hybrid annuity model (HAM), a variant to the annuity or government pay model with a 40% upfront capital support and annuity; and (ii) toll–operate–transfer (TOT), intended to monetize public-funded national highway projects that are operational and are generating toll revenues for at least 2 years (modified to 1 year for select preapproved projects, after the commercial operation date).
Under the HAM mode, the government provides 40% of the project cost as construction support to the private developer during the construction period, and the balance of 60% as annuity payments over the concession period along with interest on the outstanding amount to the concessionaire. There is a separate provision for operation and maintenance (O&M) payments by the government to the concessionaire. The private party does not have to bear the traffic risk. All payments have been inflation indexed by a price multiple index, which is a weighted average of the wholesale price index and consumer price index for industrial workers in the ratio of 70:30. This mitigates the inflation risk for the developer.1
In the TOT model, the right of collection and appropriation of fees for selected operational national highway projects constructed through public funding shall be assigned for a predetermined concession period to concessionaires (developers or investors) against upfront payment of a lumpsum amount to the NHAI. Such assignment of rights shall be based on the toll revenue potential of the identified national highway projects. O&M obligations of such projects shall be with the concessionaire until the completion of the concession period. The concessionaires for such projects shall be appointed through a transparent and uniform procurement process within the ambit of a predefined and approved implementation framework.
- 1Government of India, MORTH. Standard Documents (accessed 15 July 2023)
Roads
Sector Master Plan
While each state has its own plan for developing state roads, at the central level, the national government has plans for national highways. The Government of India has launched major initiatives to upgrade and strengthen national highways through various phases of the NHDP. The overall vision and progress under the NHDP are shown in the table.
Phases and Progress of Projects Under the National Highways Development Project
NHDP Phase Total Length (km) Length Completed up to 31 Mar 2022 Length Completed During 1 Apr 2022 to 31 Dec 2022) Length Completed up to 31 Dec 2022 Length to Be Completed SARDP-NE (Phase A) 6,418 4,212 261 4,473 1,945 LWE (including Vijayawada Ranchi Route) 6,085 5,797 31 5,818 267 EAP (WB, JICA, ADB) 2,855 1,521 243 1,764 1,091 Bharatmala Pariyojana Phase – I 34,800 8,942 2,847 11,789 23,011 Bharatmala Pariyojana (I+II+III+IV); port connection and upgradation with 2-, 4-, and 6-laning; development of North–South, and East–West Corridor 46,278 37,579 1,106 38,685 7,593 Phase V, 6-laning of Golden Quadrilateral and highdensity corridor 6,500 3,799 289 4,088 2,412 Phase VI: Expressways 1,000 209 10 219 781 Phase VII: Ring roads, bypasses, flyovers, and other structures 700 150 31 181 519 ADB = Asian Development Bank, EAP = externally aided projects, JICA = Japan International Cooperation Agency, km = kilometer, LWE = left wing extremism affected area, SARDP-NE = Special Accelerated Road Development Program for North Eastern India region, WB = World Bank.
Sources: Government of India, Ministry of Road Transport and Highways. 2021. Annual Report 2020-21; and Government of India, Ministry of Road Transport and Highways. 2023. Annual Report 2022–2023.
The MORTH has initiated several programs on highway development in the country with specific goals for the medium and long term.
Bharatmala Pariyojana
In October 2017, the Cabinet Committee on Economic Affairs approved the implementation of an umbrella program for national highways, the Bharatmala Pariyojana (Phase I). The program aimed to construct and upgrade the national highways (34,800 kilometers [km] long) over 5 years (2017–2018 through 2021– 2022) at an estimated outlay of ₹5,350 billion ($73.28 billion). The program sought to optimize the efficiency of freight and passenger movement across the country by bridging critical infrastructure gaps. Also envisaged are effective interventions, such as the development of economic corridors, inter-corridors and feeder routes, and national corridor. As of March 2023, about 38% of the length had been completed.The plan under the program is shown in below table.1
Under the Bharatmala program, up to 60%–70% of roads are proposed to be taken up under the HAM; 10% under the BOT (toll); and the rest under engineering, procurement, and construction (EPC). Bharatmala I faced delays on account of the coronavirus disease (COVID-19) pandemic, and certain projects are still being executed. Bharatmala II is being considered for the construction of road projects totaling 5,000 km combined.
- 1Government of India, MORTH. 2023. Report of the Comptroller and Auditor General of India on Implementation of Phase 1 of Bharatmala Pariyojana. No. 19 of 2023 (Performance Audit).
Project Progress Under the Bharatmala Pariyojana Project (as of 31 March 2023)
Components of BPP–I CCEA Approved Length (km) CCEA Approved Estimates (₹ billion) Total Sanctioned Cost of BPP–I Projects (₹ million) National Highways Length Completed (km) National Highways Length Completed (%) Economic corridors 9,000 1,200 2,856 3,807 42.3 Inter-corridors and feeder roads 6,000 800 1,040 1,614 26.9 National corridor efficiency improvement 5,000 1,000 1,050 1,638 32.7 Border and international connectivity roads 2,000 250 140 1,256 62.8 Coastal and port connectivity roads 2,000 200 75 104 5.2 Expressways 800 400 1,581 958 119.7 Subtotal 24,800 3,850 6,743 9,377 37.8 Ongoing projects, including NHDP 10,000 1,500 1,722 4,122 41.2 Total 34,800 5,350 8,465 13,499 38.7 BPP-I = Bharatmala Pariyojana Phase I, CCEA = Cabinet Committee on Economic Affairs, km = kilometer, NHDP = National Highways Development Project
Note: Numbers may not sum precisely because of rounding.
Source: Government of India, Ministry of Road Transport and Highways. 2023. Report of the Comptroller and Auditor General of India on Implementation of Phase I of Bharatmala Pariyojana. No. 19 of 2023 (Performance Audit).
Setu Bharatam
To ensure safe and smooth flow of traffic, the MORTH has envisaged a plan to replace level crossings on national highways with road over bridge (ROB) or road under bridge (RUB) under a scheme known as the Setu Bharatam. Under this program, out of 174 ROBs or RUBs to be constructed, 91 have been sanctioned with an estimated cost of ₹71.05 billion ($0.97 billion). Out of the 91 sanctioned, 59 ROBs or RUBs have been awarded and are in various stages of progress.2
Highway Projects in North-East India
Projects worth ₹1,900 billion ($26.02 billion) have been sanctioned for the construction of roads for more than 12,000 km in the North-East region. The projects being executed by the NHIDCL in 2022 cost around ₹1.66 trillion ($22.74 billion), covering 10,892 km of roads in all the North-East states. According to the latest information from the Ministry of Development of North-East Region, the total length of national highways in the state of Assam in 2013 was 2,771 km, and in July 2023, it was 3,651 km.3
Logistics Parks
A network of 35 multimodal logistics parks has been identified for development under Phase 1 of Bharatmala Pariyojana. The availability of the land parcels needed to develop multimodal logistics parks has been confirmed at seven locations, and detailed project reports have been initiated in all the nodes.
According to the Summary Report of the Task Force on National Infrastructure Pipeline, a total capital expenditure of ₹20.34 trillion ($278.59 billion) by both central and state governments will be made between FY2020 and FY2025. About 1,820 projects have been identified to be implemented in 2020– 2025. The central government’s total capital expenditure for these projects is estimated at ₹13.8 trillion ($189.02 billion) over FY2020 to FY2025.
- 2Government of India, MORTH. Setu Bharatam (accessed 15 July 2023).
- 3Government of India, Ministry of Development of North-East Region, Press Information Bureau. 2023. Infrastructure Projects in Assam. Press release. 3 August.
Projects under Preparation and Procurement
Roads Public–Private Partnerships under Preparation and Procurement
COMPAREDOWNLOADNotes:
1. The hyphen symbol (-) means data are not available.
2. Projects under conceptualization and development have been extracted from the India Investment Grid website. The website serves as a repository of a list of projects under the National Infrastructure Pipeline (NIP), which is constantly updated and provides attractive investment opportunities. The website also features the non-NIP, which includes additional project opportunities collated by the India Infrastructure Grid.
Source: Government of India, Ministry of Commerce and Industry, Department for Promotion of Industry and Internal Trade, India Investment Grid. Projects under NIP and Non-NIP (accessed 15 July 2023).
Roads
Features of Past PPP Projects
Procurement of PPP Projects
Roads Public-Private Partnerships procured through various modes
COMPAREDOWNLOADLEARN MORERoads
Features of Past PPP Projects
The World Bank Private Participation in Infrastructure (PPI) database has been the basis for evaluating past PPP projects in each sector. The World Bank database is used for consistency across the 15 countries covered as part of the PPP Monitor and to enable cross-country and cross-sector comparisons.
However, in India, the Department of Economic Affairs (DEA) maintains a comprehensive database of awarded PPP projects until 2019. Beyond 2019, data is available on the National Infrastructure Pipeline (NIP) website. The DEA’s database is also used as basis for evaluating PPP projects, and it supplements the data provided by the World Bank PPI database.
Notes: Only active and concluded projects are considered in the graph. The hyphen symbol (-) means there are no projects in the sector, data are unavailable or not applicable, according to the database. Information on 66 projects (up to 2022) is either not available or not applicable, according to the database, and is therefore excluded.
Source: World Bank. Infrastructure Finance, PPPs and Guarantees. Custom Query (accessed 3 January 2024).
PPP Projects Reaching Financial Close
Roads Public-Private Partnerships reaching Financial Close
COMPAREDOWNLOADPPP = public–private partnership.
Note: Only active and concluded projects are considered in the graph.
Source: World Bank. Infrastructure Finance, PPPs and Guarantees. Custom Query (accessed 3 January 2024).
PPP Projects with Foreign Sponsor Participation
Roads Public-Private Partnerships with Foreign Sponsor Participation
COMPAREDOWNLOADPPP = public–private partnership.
Notes: Only active and concluded projects are considered in the graph. Information on eight projects (1990–2022) is either partially available or not available and, hence, excluded.
Source: World Bank. Infrastructure Finance, PPPs and Guarantees. Custom Query (accessed 3 January 2024).
Government Support to PPP Projects
Government Support for Roads Public-Private Partnerships
COMPAREDOWNLOADNote: Only active and concluded projects are considered in the graph.
Source: World Bank. Infrastructure Finance, PPPs and Guarantees. Custom Query (accessed 3 January 2024).
Payment Mechanism for PPP Projects
Payment Mechanisms for Roads Public-Private Partnerships
COMPAREDOWNLOADNote: Only active and concluded projects are considered in the graph.
Source: World Bank. Infrastructure Finance, PPPs and Guarantees. Custom Query (accessed 3 January 2024).
Past PPP projects in the road sector classified in terms of PPP variant or scheme, based on the DEA database, are presented in the table.
Number of Road and Bridge Projects Across Public–Private Partnership Variants
Public–Private Partnership Variant No. of Projects Build–operate–transfer 305 Build–operate–transfer (toll + annuity) 29 Build–operate–transfer (annuity) 117 Build–operate–transfer (toll) 85 Build–own–operate–transfer 3 Design–build–finance–operate 2 Design–build–finance–operate–maintain–transfer (annuity) 8 Design–build–finance–operate–transfer 79 Design–build–finance–operate–transfer (annuity) 12 Design–build–finance–operate–transfer (toll) 53 Design–build–operate–transfer 1 Design–build–operate–transfer (annuity) 11 Hybrid annuity mode 50 Management contract (operation and maintenance) 31 Not available 38 Total 824 Note: Data was last updated on 5 December 2019.
Source: Government of India, Ministry of Finance, Department of Economic Affairs. List of All PPP Projects (accessed 15 July 2023).
Typical Risk Allocation for PPP Projects
COMPAREDOWNLOADType of Risk Private Public Shared Comment Traffic Collection risk Competition risk The model agreement provides exclusivity for 10 years or until the project achieves 90% utilization. Government payment risk Environmental and social risk Land acquisition risk Permits Geotechnical risk Brownfield risk: inventories studies, property boundaries, project scope Political risk Force majeure Foreign exchange risk Construction risk Financing risk Tariff risk - Yes
- Not Applicable
LEARN MORERoads
Features of Past PPP Projects
Generic Risk-Sharing Matrix Across Variants
Model Financing Risk Construction Risk Traffic Risk O&M Risk Typical Concession Period BOT (toll) Concessionaire Concessionaire Concessionaire Concessionaire 30 years BOT (annuity) Concessionaire Concessionaire Authority Concessionaire 15 years HAM Concessionaire Concessionaire Authority Concessionaire 15 years TOT Concessionaire Not Relevant Concessionaire Concessionaire 30 years OMT Authority Not Relevant Authority Concessionaire UA BOT = build–operate–transfer, HAM = hybrid annuity model, O&M = operation and maintenance, OMT = operate– maintain–transfer, TOT = toll–operate–transfer, UA = unavailable.
Source: Government of India, Ministry of Finance, Department of Economic Affairs. Online PPP Structuring Toolkit.
Financing Details
Parameter 1990–2020 1990–2021 1990–2022 PPP projects with foreign lending participation 7 8 8 PPP projects that received export credit agency/international financing institution support 1 1 1 Typical debt:equity ratio (60–80) : (40–20) Time for financial close Typically, 6 months (extendable) Typical concession period 15–20 years Typical financial internal rate of return UA - UA = Unavailable
PPP = public–private partnership
Source: World Bank. Infrastructure Finance, PPPs and Guarantees. Custom Query (accessed 3 January 2024).
Roads
Tariffs
Tariffs for PPP projects in the country are regulated by the NHAI by way of toll notifications issued with an annual indexation factor. The central government may, via an Official Gazette notification, levy fees at such rates as may be laid down by rules made for services or benefits rendered in relation to the use of ferries, permanent bridges, temporary bridges, and tunnels on national highways, and the use of sections of national highways. For projects supported by public funds, annuities, or SPVs, the government collects a user fee (toll) by engaging the contractors through competitive e-bidding. For projects with private investment and/or under an operate–maintain–transfer scheme, the concessionaire collects the user fee (toll). In India, tolling is generally under an open system, whereby the fee payable is a fixed amount based on the length of stretch under one project, which is normally 60 km. If a stretch is shorter, then the user fee collected is based only on the actual length.1
Annual revision takes effect from 1 April, and the fee is rounded to the nearest ₹5 in accordance with the new user fee rules. However, some roads built before 2008 are governed by the old rules, wherein the fee is rounded to ₹1 only. According to the rule, a concessionaire has the right to collect a user fee until the completion of the concession period under the agreement. Once a highway is built, a fee is collected to recover the cost. Once the cost is recovered, the fee is collected at a reduced rate of 40% as the road is to be maintained in good condition for the users.
The levy of user fees is governed by the
- National Highways Fee (Determination of Rates and Collection) Rules, 2008; and
- National Highways Rules, 1997, permitting collection of fees for (i) the use of sections of national highways, and permanent and temporary bridges on national highways; and (ii) the use of sections of national highways and permanent bridges delivered as a public-funded project.
According to National Highways Fee (Determination of Rates and Collection) Rules, 2008, the base fees per kilometer are established for the base year 2007–2008 for various types of vehicles for highways of four lanes or above. For two-lane highways, the rate was fixed at 60% of base fees indicated above. The base fee increase was also linked to the additional capital expenditure that may be incurred beyond the average cost computed by the NHAI. From the base year onward, the annual increase was provided by indexing it to the wholesale price index of the country and considering 40% of the wholesale price index as the increase for the subsequent year. The toll for public- and private-funded projects are the same.
- 1Government of India, MORTH. NH User Fee (Toll). Gazette Notifications.
Roads
Challenges
While the road sector is the most mature sector for PPPs in India and has seen innovative models and many successes, it nonetheless faces financing and operational issues. Some of these issues are as follows:
- Increased costs, stressed assets, and financing constraints
- Land acquisition costs have increased in recent years because of the higher compensation required under the Right to Fair Compensation and Transparency in Land Acquisition, Rehabilitation and Resettlement Act, in addition to the general surge in market rates.
- As per a 2016 report by the Standing Committee on Transport, Tourism and Culture, numerous road assets have turned into nonperforming assets.1 The Committee attributes this to project bids being prepared without proper study and projects being awarded in a hurry, resulting in stalling of projects. This has placed significant strain on lenders, creating reluctance in new lending. Additionally, many banks are approaching or reaching the sector lending limits set by the Reserve Bank of India, adding to the challenges.
- During construction stage, delays in receiving approvals, including environmental clearance and forest clearance, and delays in achieving financial closures continue to affect investor confidence. However, the NHAI has been taking several initiatives to address these issues.
- Aggressive bidding continues to affect the sector in models where traffic risk is assumed by the private sector, or in models where HAM is implemented. Although the number of projects relying solely on tolls has decreased compared to the previous decade, the challenge lies in resolving the operational projects that have been stalled because of aggressive bidding.
- Several project developers are facing disputes with the NHAI for operational and financial reasons, which occasionally require significant time for resolution or have the potential to evolve into legal disputes.2
The MORTH has been taking several policy and technology initiatives to address these issues, including special steps to assist languishing projects, faster and affordable dispute resolution mechanisms such as establishing the Society for Affordable Redressal of Disputes, and implementation of automatic toll pay system in a competitive manner. In 2022, the MORTH made a few changes in model concession agreements (MCAs) of various procurement modes, a summary of which follows:
- Changes in MCA of build–operate–transfer (toll) projects
- Changes have been made to the relevant clauses of the MCA of BOT (toll) project, permitting the change of ownership from the existing 2 years to 1 year after the commercial operation date (COD). This move will free the equity or funds of construction companies to take up other projects.3
- Changes in MCA of hybrid annuity model
- The MORTH has amended the standard request for proposal document of the HAM mode project to incorporate provisions relating to threshold technical capacity prescribed for similar work experience for EPC works related to major bridges and tunnels. This enables the NHAI to procure concessionaires that have appropriate experience in major bridges and tunnels for projects being executed under HAM mode. Changes have been made to the relevant clauses of the model request for proposal and MCA of the HAM project to allow the lowest quoted bid project cost as the basis for awarding the HAM project and O&M cost to be fixed as in EPC projects.
- 1PRS Legislative Research. 2016. Summary of Report Prepared by Standing Committee on Transport, Tourism and Culture.
- 2Deccan Herald. 2022. Contractors Claims ₹88,000 Crore in Highway Project Disputes. 20 March.
- 3Government of India, Ministry of Road Transport and Highways. 2022. Annual Report 2022–23.
- Increased costs, stressed assets, and financing constraints
-
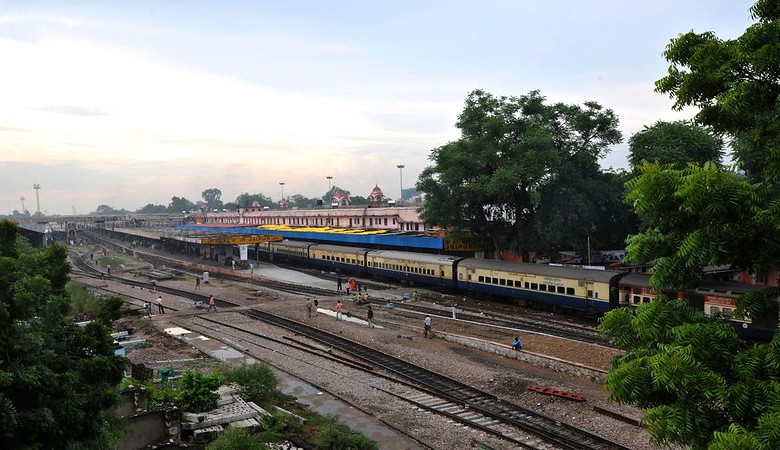
Railways
-
Railway Network Length
128,305 km
-
Number of Passengers
231,126 M pkm
-
Freight Volume
719,762 M ton-km
-
Railway Infrastructure Quality
4.4
-
Number of PPPs Reaching FC
11
-
Value of PPPs Reaching FC
7,958 M
-
Number of PPPs with Foreign Sponsors
2
-
Number of PPPs with Govt. Support
4
FC = financial closure, Govt = government, km = kilometers, M = million, pkm = passenger-kilometer, ton-km = ton-kilometer.
Notes: Passenger-kilometer refers to the transport of one person over 1 km, with the data expressed in millions of pkm. Ton-kilometer refers to the transport of a ton of cargo over 1 km, with the data expressed in millions of ton-km. Quality of railway infrastructure: 1 (lowest) – 7 (highest).
Sources: Government of India, Ministry of Railways. 2022. Indian Railways Yearbook, 2021–2022; and The Global Economy. 2019. Railroad Infrastructure Quality—Country Rankings, 2009–2019 (accessed 15 July 2023).
Railways
Contracting Agencies
The Indian Railways, or entities under it, assume the role of contracting agencies depending on the nature of the railway project. For example, for land development tenders, the Rail Land Development Authority is the contracting agency; for railway station development, it is the Indian Railway Stations Development Corporation. The Ministry of Railways (Railway Board) is the contracting agency for railway system development and zonal railways when projects are limited to specific zones. Table shows the key agencies that engage with private sector players across various projects in the railway sector.
Key Institutions
Agency Function Rail Land Development Authority (RLDA) The RLDA is a statutory authority under the Ministry of Railways, set up by an amendment to the Railways Act, 1989 for developing vacant railway land for commercial use and for the purpose of generating revenue through nontariff measures. Dedicated Freight Corridor Corporation of India Limited (DFCCIL) Set up in 2006 by the Ministry of Railways, the DFCCIL is a special purpose vehicle for the construction and operation and maintenance of dedicated freight corridors. The DFCCIL is responsible for planning and development, mobilization of financial resources and construction, and operation and maintenance of dedicated freight corridors. Indian Railway Stations Development Corporation Limited (IRSDC) The IRSDC is a special purpose vehicle formed through a joint venture of the RLDA and Ircon International Limited, an initiative by the Ministry of Railways. The joint venture aims to develop and/or redevelop new and existing railway stations and develop real estate on railway and/or government land.
The company’s mandate is to carry on any railway infrastructure work including development of railway stations under schemes such as build–operate– transfer, build–own–operate–transfer, build–lease–transfer, or any projects found suitable and related to railway station infrastructure projects and other ancillary fields.Sources: Dedicated Freight Corridor Corporation of India Limited. About Us; Indian Railway Stations Development Corporation Limited. About IRSDChttp://irsdc.in/about-irsdc; and Rail Land Development Authority. About Us.
The Ministry of Railways, through the Railway Board, has directly awarded projects related to passenger train operations. In 2019, the Railway Board, on nomination, awarded the first passenger train for private operations to the Indian Railways Catering and Tourism Corporation (IRCTC), a quasi-government agency involved traditionally in catering services and special train operations. The IRCTC signed concession agreements with private service providers, wherein operators will share their profits with the IRCTC, which in turn will pay haulage charges to the railways. Similarly, in 2020, the Railway Board came up with a procurement process to allow private participation in operating passenger train services over 12 clusters comprising more than 150 origin–destination pair of routes through introduction of 151 modern trains. The Ministry of Railways, through the Railway Board, is the direct contracting agency for these projects.
Railways
Sector Laws and Regulations
The following are the basic regulations that apply to government-financed railway projects on government infrastructure:
- Railways Act, 1989;
- Railway Protection Force (Amendment) Act, 2003;
- Railways (Amendment) Act, 2005;
- Railways (Amendment) Act, 2008;
- Participative Model for Rail Connectivity and Capacity Augmentation Projects, 2012; and
- Metro Rail Policy, 2017.
The Participative Model for Rail Connectivity and Capacity Augmentation Projects (2012) aims to fast-track Indian Railways by attracting private investment through public–private partnership (PPP). The policy provides five models for last-mile connectivity and capacity augmentation projects.1
The Metro Rail Policy (2017) boosts private investment in various ways, such as by providing viability gap funding (VGF) for projects undertaken through a PPP. The policy mandates that at least one of the project components adopt the PPP scheme to avail a grant of up to 10% of the project cost. Equity participation is also provided for project development wherein the Government of India will give financial support to metro rail projects in the form of equity and subordinate debt (equivalent of central government taxes)—subject to an overall ceiling of 20% of the project cost, excluding private investment and cost of land, rehabilitation, and resettlement—and contribute an equivalent share as that of the state government (subject to 20% upper cap).2
Sector Regulator
The Railway Board is the apex regulating authority designated to control the functions of the Indian Railways at present. Policies and pieces of legislation under different functions are being developed, amended, and regulated by the Indian Railways under the guidelines set by the different directorates falling under it. For instance, the National Transport Development Policy Committee aims to provide an integrated and sustainable transport system. Similarly, the directorate of Research Design and Standards Organization sets the technical standards of the industry.
- 1Government of India, Ministry of Railways. 2012. Participative Model for Rail Connectivity and Capacity Augmentation Projects.
- 2Government of India, Ministry of Housing and Urban Affairs. 2017. Metro Rail Policy, 2017.
Foreign Investment Restrictions
COMPAREDOWNLOADParameter 2021 2022 2023 Maximum allowed foreign ownership of equity in greenfield projects 100% 100% 100% LEARN MORERailways
Sector Laws and Regulations
In the railway infrastructure segment, the Indian Railways has, in the recent past, allowed 100% foreign ownership.1
Foreign direct investment (FDI) is allowed in the construction and O&M of the following:
- suburban corridor projects through PPP;
- high-speed train projects;
- dedicated freight lines;
- rolling stock including train sets, and locomotives or coaches manufacturing and maintenance facilities;
- railway electrification;
- signaling systems;
- freight terminals;
- passenger terminals;
- infrastructure in industrial park pertaining to railway lines or sidings, including electrified railway lines and connectivity to main railway line; and
- mass rapid transport systems.
This has opened opportunities for private sector participation in the projects of the Indian Railways. One hundred percent FDI is also permitted in metro rail projects. However, these projects fall under the mass rapid transit system and are not typically considered a part of the Indian Railways—thus they are not extensively covered in this section.
- 1Invest India. National Investment Promotion and Facilitation Agency. Policy in India (accessed 15 July 2023).
Source: Invest India. National Investment Promotion and Facilitation Agency. FDI Policy of India (accessed 15 July 2023).
Standard Contracts
COMPAREDOWNLOADType of contract Availability PPP/concession agreement Performance-based operation and maintenance contract Engineering, procurement, and construction contract - Yes
LEARN MORERailways
Sector Laws and Regulations
Although the railway sector opened for private sector participation more than 20 years ago (through a policy on development of goods sheds or sidings by private investment in railway premises, dated 23 October 1997), it has remained primarily in the non-passenger category. In 2006, the government issued a policy document and an MCA for private container train operations, giving private sector operators a nonexclusive right to haul the concessionaire’s trains carrying export–import traffic and/or domestic traffic on identified routes. The Private Freight Terminal scheme was launched in 2012 and was later revised in January 2015. This policy aims to attract private investment in setting up freight terminals through revenue-sharing principles.
The government introduced multiple railways policies and schemes on rolling stock for freight trains at various times:1
- Wagon Leasing Scheme. Launched in 2008 and revised in 2014, this scheme aims to develop strong leasing market by encouraging third-party leasing of wagons (35-year term after signing).
- Liberalized Wagon Investment Scheme. Launched in 2008 and revised in 2018, the policy seeks to provide investors with the benefit of owning and running the wagons with a special rebate in the freight (20-year term after signing).
- General-Purpose Wagon Investment Scheme. This scheme is the latest policy addition established in 2018 to encourage private investment in general-purpose wagons, such as BOX or BOXN (high-sided bogie open wagons with side discharge arrangement for loading of coal and other bulk traffic) and bogie compressed pneumatic or BCN (a special type of bogie-covered wagon with a higher carrying capacity and air brake). The scheme does not include special purpose wagons that are designed to carry a specific commodity. A rebate of 10% shall be given on the base freight on each loaded wagon. Such rebate, however, shall ordinarily be for a period of 15 years subject to a cap to the extent of the lease charges payable by the Indian Railways to the Indian Railway Finance Corporation for procurement of rolling stock. If the investment has been recovered in a period of less than 15 years, the freight rebate shall cease from the date of such full recovery. To increase private sector interest, the Indian Railways, in November 2019, liberalized the scheme, under which (i) end users (other than logistics service providers) also have been granted permission to load third-party cargo in their rakes in empty direction, which would not only reduce the empty run of the General-Purpose Wagon Investment Scheme rakes but will also entail additional revenue to end user investors in the form of freight rebate; and (ii) the design loan charges on general-purpose wagons have been reduced from 5% to 1%, which will help minimize the initial investment required for procuring wagons.
- Automobile Freight Train Operator Scheme. The policy, launched in 2021, aims to provide an opportunity to logistics service providers and road transporters to invest in wagons and use rail transport to tie up with end users.
- Master Circular on Gati Shakti Multi-Modal Cargo Terminal. Launched in 2021 and modified in 2022, the policy seeks to promote the growth of new cargo terminals and improve existing ones.
Further, there were policies in the operations of freight trains in specific categories:
- Liberalized Special Freight Train Operator Scheme issued in 2013 and revised in 2018 and 2020. The policy provides opportunity for logistics service providers or manufacturers to invest in wagons and take advantage of rail transport in tying up with end users and in marketing the train services they own for rail transportation of select commodities, which would be beneficial for railways and private players themselves (valid for a period of 20 years from the date of commercial operations of trains by the Special Freight Train Operator, extendable to 20 years).
- Automobile Freight Train Operator Scheme issued in 2013 and revised in 2015 and 2021. The policy provides opportunity for private logistics companies or transporters to run freight trains catering to the automobile sector with a flexibility to induct new higher capacity wagons, provided they meet the conditions set by the Research Design and Standards Organization (valid for a period of 20 years from the date of commercial operations of trains by the Automobile Freight Train Operator, extendable until expiry of the life of the wagons).
The above items fall within the classification of licenses. The Indian Railways formulated participative models in the construction of fixed rail infrastructure. Five of these models were developed to cater to state governments, local bodies, ports, companies, and foreign direct investors. The five models are nongovernment railway model; joint venture model; BOT through competitive bidding model; customer funded model; and capacity augmentation, annuity model. Of these five, the nongovernment railway model and joint venture model have seen some success.
The Station Redevelopment Program by Zonal Railways was launched on 8 February 2017, and 23 stations were taken up for bidding during the first stage. The modified Swiss challenge method was selected for the redevelopment of the first 23 stations.2
In 2020, the Indian Railways issued a draft MCA for public consultation in the areas of railway station development and operations of passenger trains. This is the first instance where the private sector is being invited for train operations. The Ministry of Railways also prepared an indicative list of 100 origin– destination pairs to introduce train services by private entities, divided into clusters such that each cluster would require operation of a minimum of 12 rakes.3
In 2019, India’s first privately run train, Lucknow–Delhi Tejas Express, by the IRCTC, a public sector unit under Indian Railways, began operations. With the Tejas Express being managed by the IRCTC, the physical infrastructure of the train, including locomotives, coaches, loco pilots, guards, and security personnel, are owned by Indian Railways. However, the services provided, such as ticketing and refunds, parcels, catering, and housekeeping will be contracted to private players through the IRCTC under the PPP model. The IRCTC has signed concession agreements with private service providers, under which operators will share their profits with the IRCTC, which in turn will pay haulage charges to the railways.4
The government plans to open passenger train operations for more private sector players. However, tender for passenger train operations launched in October 2020 with the Ministry of Railways had to be withdrawn in November. The scope of the project broadly included designing, engineering, procurement, financing, and O&M of passenger trains, either with distributed power or through powerheads, comprising a minimum of 16 coaches. Train services will be provided for more than 109 origin-destination pair of routes grouped in 12 clusters through introduction of 151 modern trains. The 109 origin–destination pairs have been formed into 12 clusters (projects) across the Indian Railways network. The railways have identified about 100 destinations where passenger trains will be run by companies that win these private contracts.
- 1Government of India, Indian Railways. Master Circulars (accessed 15 July 2023).
- 2Indian Railway Stations Development Corporation Limited (accessed 15 July 2023).
- 3Government of India, Ministry of Railways. 2020. Draft Model Concession Agreement for Discussion on Re-development of Railway Station. 20 January.
- 4I. Mufti and R. Sampal. 2019. Why Tejas is ‘1st Private Train’ — Railways Owns It, Outside Vendors Provide Food and Clean It. The Print. 6 October
Source: Model Concession Agreement for the Railway Sector.
Railways
Sector Master Plan
In early 2021, the Ministry of Railways issued a draft National Rail Plan (NRP), articulating the long-term objectives and targets for the railway sector.1The NRP aims to augment capacity of the railways and target higher modal share in transporting both freight and passengers. It will serve as a common platform for all future infrastructure, business, and financial planning for railways. The key objective of the NRP is to establish capacity that exceeds demand by 2030, effectively accommodating the anticipated growth in demand until 2050. This initiative aims to elevate the modal share of railways in freight from the current 27% to 45% by 2030. This commitment aligns with the national objective to reduce carbon emissions and achieve net-zero carbon emissions by 2030 (footnote 63). In addition to other objectives, the NRP seeks to significantly decrease the transit time for freight by raising the average speed of freight trains from the current 22 km per hour to 50 km per hour. Simultaneously, the initiative aims to slash the overall cost of rail transportation by almost 30%, with the intention of passing on these cost savings to customers.
As part of the NRP, Vision 2024 has been launched to accelerate implementation of critical projects by 2024 such as 100% electrification, multitracking of congested routes, upgrading of speed to 160 km per hour on the Delhi–Howrah and Delhi–Mumbai routes, upgrading of speed to 130 km per hour on all other Golden Quadrilateral–Golden Diagonal routes, and elimination of all level crossings on all Golden Quadrilateral–Golden Diagonal routes. Three additional dedicated freight corridors (namely East Coast, East-West, and North-South), along with several high-speed rail corridors, are identified in the plan. The NRP clearly identifies the role of the private sector in achieving its objectives and indicates the sustained involvement of the private sector in areas such as operations and ownership of rolling stock, development of freight and passenger terminals, and development and operations of track infrastructure.2
The National Infrastructure Pipeline (NIP) also indicates specific targets for the railway sector including higher private participation. The NIP seeks to privatize 30% of net cargo volumes and 500 passenger trains, along with 30% of 750 stations. The initiative also aims to secure rolling stock through procurement from the private sector.
The government launched the Amrit Bharat Station Scheme on 6 August 2023 to revitalize 1,309 railway stations across the nation. The scheme plans to upgrade 76 railway stations across the central railway network. The foundation stone for the redevelopment of 508 railway stations—spread across 27 states and union territories and costing more than ₹244.7 billion—was laid on 6 August 2023.64 Government of India, Prime Minister's Office, Press Information Bureau. 2023.3
The overall capital expenditure plan for the sector is shown in below table.
- 1Government of India, Ministry of Railways. 2020. National Rail Plan.
- 2Government of India, Ministry of Railways, Press Information Bureau. 2020. Indian Railways Issues Draft National Rail Plan. Press release. 18 December.
- 3Government of India, Prime Minister's Office, Press Information Bureau. 2023. PM Lays Foundation Stone for Redevelopment of 508 Railway Stations across the Country. Press release. 6 August.
Capital Expenditure Plan
Project Category No. of Projects Capital Expenditure, FY2020–FY2025 ($ billion) (₹ trillion) Railway track 695 199.91 16.39 Railway rolling stock 61 44.66 3.66 Railway terminal infrastructure 37 2.39 0.20 Total 793 246.96 20.25 FY = fiscal year.
Source: Government of India, Ministry of Commerce and Industry, Department for Promotion of Industry and Internal Trade. India Investment Grid (accessed January 2024).
The passenger train operations indicated above comprise one of the key initiatives of the Ministry of Railways to induct the private sector into the train operations in India. The Ministry of Railways has identified more than 150 pairs of train services to introduce 151 modern train sets or rakes through private sector participation. These services have been formed into 12 clusters across the Indian Railways network. Each train shall have a minimum length of 384 meters (equal to 16 cars of the Indian Railways’ trains). The project is proposed to be developed under a PPP model, in which the private entity shall be responsible for financing, procuring, and operating and maintaining the trains. The private entity can procure trains through ownership model or leasing model. The Indian Railways shall provide fixed infrastructure, including access to tracks, stations, overhead catenary for traction, train control system, and watering and cleaning lines. The private entity will be required to pay the Indian Railways fixed haulage charges, energy charges, and a share in gross revenue.3
- 3Government of India, Press Information Bureau. 2021. Ministry of Railways: Modernisation of Railway Stations. Press release. 10 March.
Projects under Preparation and Procurement
Railways Public-Private Partnerships under Preparation and Procurement
COMPAREDOWNLOADLEARN MORERailways
Sector Master Plan
Currently, there are various projects that are being procured through PPP, including modernization of railway stations and operation of passenger trains. Upgrading or modernization of railway stations has been ongoing for the last few years under various schemes. Presently, railway stations are upgraded and/or modernized under the Adarsh Station Scheme based on identified needs for providing better passenger amenities at stations. Under the scheme, 1,253 stations have been identified for development, out of which 1,215 stations so far have been developed. The remaining 38 stations are planned to be developed under the Adarsh Station Scheme by 2022–2023. The expenditure on beautification or upgradation of stations under the Adarsh Station Scheme is generally funded under Plan Head–53 “Customer Amenities.” In FY2022–2023, a total of ₹27.00 billion had been allocated under Plan Head–53.1
- 1Government of India, Ministry of Railways, Press Information Bureau. 2022. Beautification of Railway Stations. Press release. 5 August.
Notes:
1. The hyphen symbol (-) means data are not available.
2. Projects under conceptualization and development have been extracted from the India Investment Grid website.
The website serves as a repository of a list of projects under the National Infrastructure Pipeline (NIP), which is constantly updated and provides attractive investment opportunities. The website also features the non-NIP, which includes additional project opportunities collated by the India Infrastructure Grid.
Source: Government of India, Ministry of Commerce and Industry, Department for Promotion of Industry and Internal Trade, India Investment Grid. Projects under NIP and Non-NIP (accessed 15 July 2023).
Railways
Features of Past PPP Projects
Procurement of PPP Projects
Railways Public-Private Partnerships procured through various modes
COMPAREDOWNLOADNotes: Only active and concluded projects are considered in the graph. Information on one project (up to 2022) is either not available or not applicable, according to the database, and is therefore excluded.
Source: World Bank. Infrastructure Finance, PPPs and Guarantees. Custom Query (accessed 3 January 2024).
PPP Projects Reaching Financial Close
Railways Public-Private Partnerships reaching Financial Close
COMPAREDOWNLOADPPP = public–private partnership.
Note: Only active and concluded projects are considered in the graph.
Source: World Bank. Infrastructure Finance, PPPs and Guarantees. Custom Query (accessed 3 January 2024).
PPP Projects with Foreign Sponsor Participation
Railways Public-Private Partnerships with Foreign Sponsor Participation
COMPAREDOWNLOADLEARN MORERailways
Features of Past PPP Projects
Over the past 3 fiscal years, there has been no change in the number and distribution of PPP projects in the sector that have foreign sponsors or received government support. Additionally, there has been no change in the manner of their payment mechanisms. It is expected that in the coming years, this number can increase as the Ministry of Railways is likely to explore PPPs for the redevelopment of railway stations in the country.
PPP = public–private partnership.
Notes: Only active and concluded projects are considered in the graph. Information on three projects (1990–2022) is either partially available or not available and, hence, excluded.
Source: World Bank. Infrastructure Finance, PPPs and Guarantees. Custom Query (accessed 3 January 2024).
Government Support to PPP Projects
Government Support for Railways Public-Private Partnerships
COMPAREDOWNLOADNotes: Only active and concluded projects are considered in the graph. The hyphen symbol (-) means there are no projects in the sector, data are unavailable or not applicable, according to the database.
Source: World Bank. Infrastructure Finance, PPPs and Guarantees. Custom Query (accessed 3 January 2024).
Payment Mechanism for PPP Projects
Payment Mechanisms for Railways Public-Private Partnerships
COMPAREDOWNLOADNotes: Only active and concluded projects are considered in the graph. Information on three projects (up to 2022) is not applicable, according to the database, and is therefore excluded.
Source: World Bank. Infrastructure Finance, PPPs and Guarantees. Custom Query (accessed 3 January 2024).
Past PPP projects in the railway sector classified in terms of PPP variant or scheme, according to the Department of Economic Affairs (DEA) database, are shown in the table.
Number of Railway Projects Across Public–Private Partnership Variants
Public–Private Partnership Variant No. of Projects Build–operate–transfer 4 Build–operate–transfer (annuity) 1 Build–own–operate–transfer 2 Design–build–finance–operate 1 Design–build–finance–operate–transfer 1 Total 9 Note: Data was last updated on 5 December 2019.
Source: Government of India, Ministry of Finance, Department of Economic Affairs. List of All PPP Projects (accessed 15 July 2023)
Typical Risk Allocation for PPP Projects
COMPAREDOWNLOADRisk Type Private Public Shared Tariff risk Government payment risk Environmental and social risk Land acquisition risk Political risk Foreign exchange risk Traffic Collection Risk Competition risk Permits Geotechnical risk Brownfield risk: inventories, studies, property boundaries, project scope Force majeure - Yes
Financing Details
Parameter 1990–2020 1990–2021 1990–2022 PPP projects with foreign lending participation UA UA UA PPP projects that received export credit agency/international financing institution support UA UA UA Typical debt:equity ratio (65–75) : (35–25) Time for financial close UA Typical concession period 15–20 years Typical financial internal rate of return UA - UA = Unavailable
Source: World Bank. Infrastructure Finance, PPPs and Guarantees. Custom Query (accessed 3 January 2024).
Railways
Tariffs
All tariffs are set by the Railway Board (Ministry of Railways) through railway notifications for passenger and freight trains. Since the responsibility of operations of all trains lies with the Indian Railways, and private sector operators are not involved in the railway operations yet, the tariffs applicable for trains run by the Indian Railways shall also apply to the railways developed in a joint venture model.
For passenger train operations, according to the draft bidding documents issued by the Ministry of Railways, the selection of bidders shall be based on the highest share of gross revenues offered by the qualified bidder (in addition to the actual haulage charges), whereby revenues for concessionaire are defined to comprise market-linked user fare and charges or fees for other related services. This signifies that the tariff for PPP passenger trains shall not be regulated and will be determined by the private sector based on market conditions.
Railways
Challenges
Return rate conflicts. The Ministry of Finance has benchmarked the return on investment at 14% for a railway project to be economically viable. However, two of the six projects audited by the Comptroller and Auditor General have been approved by the Ministry of Railways despite having a projected internal rate of return of 10.5% and 11.8%. On the contrary, projects with an internal rate of return as high as 22% have not progressed.1 As of July 2023, all railway projects should aim for at least a 12% rate of return on investment, according to the Indian Railway Financial Code. Signaling works, which are integral to rail safety, do not require a financial viability assessment.2
Absence of set timetables for freight trains. Railway lines are shared by both freight and passenger trains. Considering the sensitivities, passenger trains are always given preference resulting in significant time delays and congestion on lines, making it unviable for using freight rails. As a result, most zonal railways have higher than optimal utilization of line capacity. The Dedicated Freight Corridor projects are expected to improve rail share in carrying freight traffic. There is also a lack of infrastructure facilities for the smooth running of terminals and sidings. Institutionalizing timetables for freight rails will facilitate the efficient operations of railway lines.
Railways use the revenue earned from freight to cross-subsidize revenue from passenger traffic. This is also one of the major reasons for the higher share of roads in freight transport. Recent improvements in road infrastructure and faster transit with initiatives like FASTag are expected to pose significant challenges to freight transport by rail in the future.
- 1Comptroller and Auditor General of India. 2014. Selection of Private Partners.https://cag.gov.in/uploads/download_audit_report/2014/Union_Performance_Railways_Public_Private_Partnership_Projects_3_2014_chapter_6.pdf
- 2A. Dastidar. 2023. Signalling Now Part of Rail Safety, Won’t Need Financial Viability Test. The Indian Express. 14 July
-
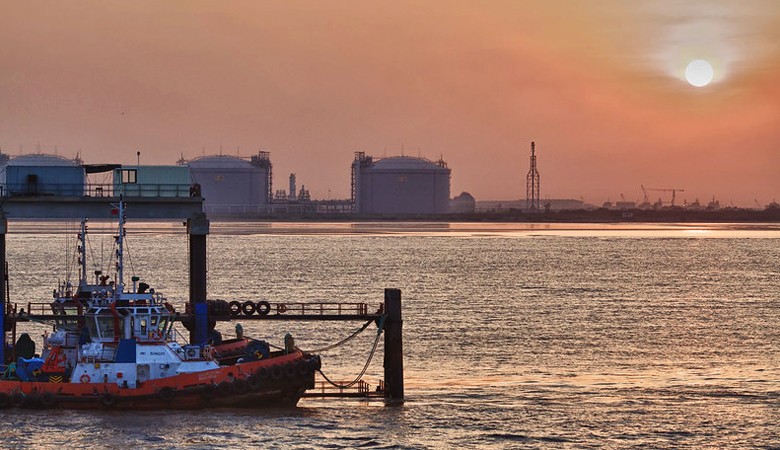
Ports
-
Number of Ports
213
-
Container Traffic
19,940,000 TEU
-
Port Infrastructure Quality
4.5
-
Number of PPPs Reaching FC
55
-
Value of PPPs Reaching FC
9,953
-
Number of PPPs with Foreign Sponsors
22
-
Number of PPPs with Govt. Support
1
MTPA = million tons per annum, TEU = twenty-foot equivalent unit, UA = unavailable.
Note: Quality of port infrastructure: 1 (lowest) – 7 (highest).
Sources: Economist Intelligence Unit. The Infrascope Archives 2009–19: India; Press Information Bureau. 2022. Cargo Handling Capacity of Ports. 11 February; The Global Economy. Port Infrastructure Quality - Country Rankings (accessed 15 July 2023); The Global Economy. Port Traffic—Country Rankings (accessed 15 July 2023); World Bank. Container Port Traffic: India (accessed 15 July 2023); Government of India; Ministry of Ports, Shipping and Waterways; and Government of India; Ministry of Ports, Shipping and Waterways. Ports Wing.
Ports
Contracting Agencies
The Ministry of Ports, Shipping and Waterways oversees the ports, shipping, and waterways sector in the country. Port development is a concurrent responsibility of both the central and state governments, according to the Constitution of India. The center-run ports (called major ports by law) are controlled by the central government while the state-run ports (called minor or nonmajor ports) are within the jurisdiction of the respective states that have coastlines.
Port Trusts are the contracting agencies for the 12 major ports. Overall, there are 13 major ports; however, one major port is a corporatized port, with two-thirds of the shares owned by the Government of India and one third by the Chennai Port Trust. The major ports were regulated by the Major Port Trusts Act, 1963, which has been replaced by the Major Port Authorities Act, 2021.
The maritime states of Andhra Pradesh, Gujarat, Karnataka, Kerala, Maharashtra, Odisha, Tamil Nadu, and West Bengal operate either through exclusively set-up Maritime Boards (authorities) or as a department under the provincial government. They have rights to plan for and develop the port sector, and enter into concessions with private sector players. Nonmajor ports are regulated by the Indian Ports Act, 1908. The Ministry of Ports, Shipping and Waterways has proposed to repeal and replace the Indian Ports Act, 1908.
For inland waterways, the Inland Waterways Authority of India (IWAI) is the overseeing authority that reports to the Ministry of Ports, Shipping and Waterways. The IWAI was set up in 1986 to develop and regulate inland waterways for shipping and navigation. It primarily undertakes projects for development and maintenance of inland waterways transport infrastructure on national waterways through a grant received from the Ministry of Ports, Shipping and Waterways. The IWAI has its head office at Noida; regional offices at Bhubaneswar, Guwahati, Kochi, Kolkata, and Patna; and suboffices at Badarpur, Dhubri, Dibrugarh, Farakka, Goa, Hemnagar, Kollam, Prayagraj, Sahibganj, Varanasi, and Vijayawada.1
- 1Government of India; Ministry of Ports, Shipping and Waterways. Inland Waterways Authority of India.
Ports
Sector Laws and Regulations
All major ports fall under the jurisdiction of the government, and thus are governed by policy directives stipulated under the Major Port Trusts Act, 1963—except the Ennore Port, which is governed under the Companies Act, 1956. The Ministry of Ports, Shipping and Waterways promulgated a new regulation, the Major Port Authorities Bill, 2020, which provides for the regulation, operation, and planning of major ports in India and provides greater autonomy to these ports. The Parliament approved the Major Port Authorities Bill, 2020 giving way to the Major Port Authorities Act, 2021, which looks to reorient the governance model in central ports to the landlord model, wherein port infrastructure is leased to private operators. The Major Port Authorities Act, 2021 was notified in the gazette by the government in February 2021. The Act aims “to provide for the regulation, operation, and planning of Major Ports in India and to vest the administration, control, and management of such ports upon the Boards of Major Port Authorities and for matters connected therewith or incidental thereto.”
The Act replaces the Major Port Trusts Act of 1963, which has been restrictive in many ways in the current market conditions. It aims to decentralize decision-making at major ports. The new Act defines public–private partnership (PPP) projects as projects taken up through a concession contract by the Board. For such projects, the Board may fix the tariff for initial bidding purposes. The appointed concessionaire will be free to fix the actual tariffs based on market conditions and other conditions as may be notified. The revenue share in such projects will be based on a specific concession agreement. Tariff issues have been a major hindrance in promoting PPPs in major ports in recent years. The Act also provides for the constitution of an Adjudicatory Board by the central government. This Board will replace the existing Tariff Authority for Major Ports constituted under the 1963 Act.
The Inland Waterways Authorities Act, 1985 was enacted to create the IWAI and its powers, functions, and activities. The government has also enacted the National Waterways Act, 2016, which provides for existing national waterways, the declaration of certain inland waterways as national waterways, and the regulation and development of these waterways for the purposes of shipping and navigation and related matters. The Act was instrumental in declaring the National Waterways 6 through 111, along with their limits as national waterways for the purposes of shipping and navigation.
Regulators in the Port Sector
The reform process for major ports was initiated in the 1990s as part of the broader strategy for infrastructure development, which called for private sector participation. The Tariff Authority for Major Ports (TAMP) was established in 1997 to regulate the tariffs for major ports. All major economic functions were directly under the ambit of the TAMP until January 2008 when the model concession agreement (MCA) was approved, allowing private sector participation, which led to improving the terminal efficiencies and investment by the private sector into port development. The government approved the revised MCA for PPP projects in major ports on 3 January 2018, and the update was released on 11 November 2021 to provide clarity on the responsibilities and obligations of parties and remedial measures in case of change in law. The Major Port Authorities Act, 2021 proposed to create an Adjudicatory Board to carry out the residual function of the TAMP, look into disputes between ports and PPP concessionaires, review stressed PPP projects and suggest measures to revive such projects, and look into complaints regarding the services rendered by the ports and private operators within the ports.1
The Ministry of Ports, Shipping and Waterways finalized the guidelines for dealing with stressed PPP projects at the major ports on 10 May 2022.71 These guidelines have been framed for the following:
- Projects that became stressed during construction stage—i.e., pre-commercial operation date (COD) stage where the work was halted because of the concessionaire’s inability to proceed with project execution. This was often attributed to factors such as aggressive bidding, overly optimistic projections related to volumes and charges, and unforeseen dynamic changes in their business environment.
- Projects at pre-COD and post-COD stages, where work has stopped because of the inability of the concessionaire to continue with the execution of the project because of the borrowings of the concessionaire being categorized by lenders as a nonperforming asset and/or proceedings initiated against it before the National Company Law Tribunal under the Insolvency and Bankruptcy Code 2016 or under Section 241(2) of the Companies Act 2013.
The State Maritime Boards regulate ports development in their respective states. However, tariffs at minor ports, unlike major ports, are not regulated.
- 1Government of India; Ministry of Ports, Shipping and Waterways. Tariff Authority for Major Ports.
Key Institutions
Agency Function (Indicative List) Ministry of Ports, Shipping and Waterways (MOPSW) - The MOPSW oversees the shipping and port sectors, which include shipbuilding and ship repair, major ports, national waterways, and inland water transport.
Indian Ports Association (IPA) - The IPA was constituted in 1966 under the Societies Registration Act to foster growth and development of all major ports that are under the supervisory control of the MOPSW. Over the years, the IPA has consolidated its activities and has strengthened its institutional capacity. It is considered as the think tank for major ports and has the goal of integrating the maritime sector.
Major Ports Adjudicatory Board (former Tariff Authority for Major Ports [TAMP]) - The Major Ports Adjudicatory Board replaced TAMP in 2023 as the nodal body for tariff setting and public–private partnership (PPP) dispute resolution for all 12 major ports in India. It will be governed by the Major Port Authorities Act, 2021. The Adjudicatory Board shall consist of a presiding officer and two members. The presiding officer shall be a retired Judge of the Supreme Court of India or a retired Chief Justice of a High Court. The two members shall either be a retired Chief Secretary of a state government or equivalent, or a retired Secretary of the Government of India or equivalent.
Sagarmala Development Company Limited (SDCL) - Incorporated in August 2016, the SDCL has been set up under the Companies Act, 2013 and under the administrative control of the MOPSW. Implementation of the projects identified under the Sagarmala program will be taken up by the relevant ports, state governments, maritime boards, and central ministries mainly through private or public–private partnership mode. The SDCL will provide equity support for these projects via special purpose vehicles set up by the ports, states, and central ministries, as well as through a funding window. It will implement only those residual projects that cannot be funded by any other means or mode.
Inland Waterways Authority of India (IWAI) - IWAI came into existence on 27 October 1986 to develop and regulate inland waterways for shipping and navigation. It primarily undertakes projects for development and maintenance of inland waterways transport infrastructure on national waterways through a grant received from the MOPSW.
Indian Port Rail Corporation Limited (IPRCL) - The IPRCL is incorporated under the Companies Act, 2013 under the administrative control of the MOPSW, with stake by the 11 major ports and 10% by Rail Vikas Nigam Limited. It is also proposed that the IPRCL may raise funding from multilateral and bilateral agencies and other financial institutions. It aims to execute the last-mile connectivity, rail connectivity, and internal rail projects of the major ports more effectively and efficiently using a special purpose vehicle.
Sources: Government of India; Ministry of Ports, Shipping and Waterways. Sagarmala; Government of India; Ministry of Ports, Shipping and Waterways. About Us; Government of India; Ministry of Ports, Shipping and Waterways. IPRCL; Indian Ports Association; and Inland Waterways Authority of India. About Us.
Foreign Investment Restrictions
COMPAREDOWNLOADParameter 2021 2022 2023 Maximum allowed foreign ownership of equity in greenfield projects 100% 100% 100% Standard Contracts
COMPAREDOWNLOADType of contract Availability PPP/concession agreement Performance-based operation and maintenance contract Engineering, procurement, and construction contract - Yes
LEARN MOREPorts
Sector Laws and Regulations
The centrally controlled ports (major ports) are guided by the model documents approved by the DEA. On the other hand, the states and provinces have freedom to choose their own standard bidding documents and are not required to abide by the standard contracts issued by the central government. For example, the state of Gujarat (Gujarat Maritime Board), the largest maritime state in terms of throughput, has developed its own model agreements.
The MCA in 2021 recommended the following modifications over the existing MCA suggested in 2018:1
- A provision on "Change in Cargo due to change in law or unforeseen Events" has been introduced for the first time. It gives the flexibility to undertake change in cargo in situations where traffic for a particular commodity has dropped during the concession period because of external and unforeseen factors.
- The new MCA provides flexibility to the concessionaires to fix their tariff based on market conditions.
- The minimum guaranteed throughput will be linked to royalty payment and a new bidding parameter has been proposed in line with changes in tariff levying mechanism.
- A provision of compensation for the termination of the concession agreement due to the concessionaire’s default before the commencement of operations has been added.
- A provision has also been included for the of the terminal’s draft through extra dredging during the concession period, with the cost and risk of dredging being shared.
- Key performance indicators for the concessioning authority have been established.
- The start date for license fee payments has been specified.
- Performance security has been assumed for the entire concession duration, consistent with the other sectors.
- 1Government of India; Ministry of Ports, Shipping and Waterways. 2021. Model Concession Agreement 2021 for Public– Private Partnership (PPP) in Major Ports. 12 November.
Ports
Sector Master Plan
The master plan for the ports and waterways sector is covered under the Sagarmala Program. The concept of the Sagarmala Program was approved in March 2015. As part of the program, the National Perspective Plan for the comprehensive development of India's maritime sector, including 7,500 km of coastline and 14,500 km of potentially navigable waterways, was prepared in April 2016.
The Sagarmala Program includes more than 800 projects (with an estimated total cost of ₹5.48 trillion or $66.8 billion) that have been identified for implementation over 2015–2035 across the areas of port modernization and new port development, port connectivity enhancement, port-linked industrialization, and coastal community development. According to the 2022–2023 Annual Report by the Ministry of Ports, Shipping and Waterways, 220 projects with a total cost of ₹1,122 billion ($13.69 billion) had been completed and 231 projects (with an estimated total cost of ₹2,208 billion or $26.93 billion) were under Implementation.1
- 1Government of India; Ministry of Ports, Shipping and Waterways. 2023. Annual Report 2022–23.
Estimated Expenditure of Initiatives in the Port Sector Under the Sagarmala Program of the Ministry of Ports, Shipping and Waterways
Pillar Completed Under Implementation Under Development Total Cost Number Value (₹ billion) Number Value (₹ billion) Number Value (₹ billion) Number Value (₹ billion) Port modernization 89 312 63 640 89 1,543 241 2,496 Port connectivity 69 320 67 762 73 339 209 1,422 Port-led industrialization 9 458 21 727 3 12 33 1,198 Coastal community development 20 14 19 25 43 73 82 113 Coastal shipping and IWT 33 17 61 52 143 102 237 172 Grand Total 220 1,122 231 2,208 351 2,071 802 5,401 IWT = inland waterways transport.
Note: Numbers may not sum precisely because of rounding.
Source: Government of India; Ministry of Ports, Shipping and Waterways. 2023. Annual Report 2022–23.
Projects under Preparation and Procurement
Ports Public-Private Partnerships under Preparation and Procurement
COMPAREDOWNLOADNotes:
1. The hyphen symbol (-) means data are not available.
2. Projects under conceptualization and development have been extracted from the India Investment Grid website. The website serves as a repository of a list of projects under the National Infrastructure Pipeline (NIP), which is constantly updated and provides attractive investment opportunities. The website also features the non-NIP, which includes additional project opportunities collated by the India Infrastructure Grid.
Source: Government of India, Ministry of Commerce and Industry, Department for Promotion of Industry and Internal Trade, India Investment Grid. Projects under NIP and Non-NIP (accessed 15 July 2023).
Ports
Features of Past PPP Projects
Procurement of PPP Projects
Ports Public-Private Partnerships procured through various modes
COMPAREDOWNLOADNotes: Only active and concluded projects are considered in the graph. One project awarded on license/franchise basis is included in the competitive bids category. Information on 21 projects (up to 2022) is either not available or not applicable, according to the database, and is therefore excluded.
Source: World Bank. Infrastructure Finance, PPPs and Guarantees. Custom Query (accessed 3 January 2024).
PPP Projects Reaching Financial Close
Ports Public-Private Partnerships reaching Financial Close
COMPAREDOWNLOADPPP = public–private partnership.
Note: Only active and concluded projects are considered in the graph.
Source: World Bank. Infrastructure Finance, PPPs and Guarantees. Custom Query (accessed 3 January 2024).
PPP Projects with Foreign Sponsor Participation
Ports Public-Private Partnerships with Foreign Sponsor Participation
COMPAREDOWNLOADPPP = public–private partnership.
Notes: Only active and concluded projects are considered in the graph. Information on three projects (1990–2022) is either partially available or not available and, hence, excluded.
Source: World Bank. Infrastructure Finance, PPPs and Guarantees. Custom Query (accessed 3 January 2024).
Government Support to PPP Projects
Government Support for Ports Public-Private Partnerships
COMPAREDOWNLOADNotes: Only active and concluded projects are considered in the graph. One project awarded on license/franchise basis is included in the competitive bids category. Information on 21 projects (up to 2022) is either not available or not applicable, according to the database, and is therefore excluded.
Source: World Bank. Infrastructure Finance, PPPs and Guarantees. Custom Query (accessed 3 January 2024).
Payment Mechanism for PPP Projects
Payment Mechanisms for Ports Public-Private Partnerships
COMPAREDOWNLOADLEARN MOREPorts
Features of Past PPP Projects
The payment mechanisms for the port sector (major ports) are in the form of revenue share or royalty per ton or twenty-foot equivalent unit, in addition to land lease and license fees.
Notes: Only active and concluded projects are considered in the graph. The hyphen symbol (-) means there are no projects in the sector, data are unavailable or not applicable, according to the database.
Source: World Bank. Infrastructure Finance, PPPs and Guarantees. Custom Query (accessed 3 January 2024).
Past PPP projects in the port sector classified in terms of PPP variant or scheme, according to the Department of Economic Affairs (DEA) database, are shown in the table.
Number of Port Projects Across Public–Private Partnership Variants
Public–Private Partnership Variant No. of Projects Build–operate–transfer 29 Build–operate–transfer (annuity) 1 Build–own–lease–transfer 1 Build–own–operate 1 Build–own–operate–manage 5 Build–own–operate–share–transfer 12 Build–own–operate–transfer 17 Design–build–finance–operate 1 Design–build–finance–operate–transfer 24 Lease 1 Management contract (operation and maintenance) 1 Operate–maintain–share–transfer 1 Not available 5 Total 99 Note: The list includes nonmajor ports and terminals awarded within major ports. Data was last updated on 5 December 2019.
Source: Government of India, Ministry of Finance, Department of Economic Affairs. List of All PPP Projects (accessed 15 July 2023).
Typical Risk Allocation for PPP Projects
COMPAREDOWNLOADRisk Type Private Public Shared Demand risk Competition risk (exclusivity) Tariff risk Environmental and social risk Permits Geotechnical risk Land acquisition risk Foreign exchange risk Force majeure risk Political risk - Yes
Financing Details
Parameter 1990–2020 1990–2021 1990–2022 PPP projects with foreign lending participation 2 2 4 PPP projects that received export credit agency/international financing institution support 3 3 4 Typical debt:equity ratio (75–70) : (25–30) Time for financial close Typically, 6 months Typical concession period 30 years Typical financial internal rate of return UA - UA = Unavailable
Source: World Bank. Infrastructure Finance, PPPs and Guarantees. Custom Query (accessed 3 January 2024).
Ports
Tariffs
Private sector operators in the major port sector are under a regulated tariff regime. There were multiple tariff regimes that were enacted for major ports over time including Tariff Guidelines 2005, Upfront Tariff Guidelines 2008, Reference Tariff Guidelines 2013, Tariff Guidelines 2019, Tariff Policy for Major Port Authorities 2021, and Tariff Guidelines 2021 for future PPP concessionaire.1
The tariff has been typically fixed based on cost-plus model and restricting the returns of the private sector player on return of net capital employed. Changing tariff guidelines, which restricted tariff flexibility to port operators, had led to financial distress. Consequently, the sector had become unattractive to private sector players in major ports until the guidelines of 2013 provided some flexibility. The 2021 guidelines allow the concessionaires at major ports to set tariffs based on market dynamics. The Major Port Authority Act, 2021 also gives the port authority the power to fix tariffs, which will serve as a reference tariff for purposes of bidding for major PPP projects, facilitating greater flexibility in the governance of major ports.
State governments, however, provide full flexibility to the port operators at the minor ports and select them based on either royalty per ton or twenty-foot equivalent unit or on highest revenue share basis.
- 1Government of India; Ministry of Ports, Shipping, and Waterways. 2021. Tariff Policy for Major Port Authorities 2021. 3 November; and Government of India; Ministry of Ports, Shipping and Waterways. 2021. Tariff Guidelines 2021 for Future PPP Concessionaire. 21 December.
Ports
Challenges
- The existence of multiple tariff regimes and inflexible contracts has highlighted the need for more adaptable and collaborative partnerships. This situation presents an opportunity for private operators to advocate for more flexibility and responsiveness in addressing challenges beyond those classified as force majeure.
- The experience of losses due to delayed decision-making and resolutions by major port trusts underscores the importance of empowering these trusts and clarifying ownership. This situation could lead to the development of more precise contractual clauses, reducing ambiguity and fostering a higher level of confidence among private sector players regarding fair contractual enforcement.
- The intense competition with minor ports, which have greater flexibility in tariff setting and providing value-added facilities, can motivate major ports to innovate and improve their competitiveness.
- The current state of road and rail networks, cargo handling equipment, navigational aids, information technology systems, dredging capacity, and technical expertise highlights areas for improvement. Addressing these areas could significantly enhance the efficiency of Indian ports and make them more attractive to private sector players.
The competitiveness and efficiency of both major and nonmajor ports are likely to improve in the short term through developments under the Major Ports Authority Bill—revising the model concession agreements (MCAs) to make them balanced and increasing investments in technology and connectivity—and through the initiatives of Sagarmala. With the aim to reduce litigations in the port sector, the Ministry of Ports, Shipping and Waterways has launched the new MCA, 2021. In addition, new tariff guidelines have been issued to provide flexibility for the private firm to fix tariffs based on the existing market dynamics, and introduce differential royalty rates to promote coastal shipping and transshipment.
-
Airports

-
Number of Airports
147
-
Passenger Capacity
123.2 M
-
Airport Infrastructure Quality
4.9
-
Number of PPPs Reaching FC
18
-
Value of PPPs Reaching FC
14,687
-
Number of PPPs with Foreign Sponsors
9
-
Number of PPPs with Govt. Support
1
FC = financial closure, Govt. = government, M = million.
Note: Quality of airport infrastructure: 1(lowest) – 7(highest).
Sources: Airports Authority of India. List of Airports (accessed 15 July 2023); Government of India, Ministry of Civil Aviation. 2023. Annual Report 2022; and The Global Economy. Compare Countries with Annual Data from Official Resources (accessed 15 July 2023).
Airports
Contracting Agencies
The Ministry of Civil Aviation is responsible for the formulation of national policies and programs for developing and regulating the civil aviation sector in India. The ministry exercises administrative control over attached and autonomous organizations such as the Airports Authority of India (AAI), the Directorate General of Civil Aviation, and the Bureau of Civil Aviation Security. Key pieces of legislation and policies governing the airport sector include the AAI Act, 1994; Policy on Airport Infrastructure; Domestic Air Transport Policy; Aircraft Act, 1934; and Airport Rules and the Open Sky Policy.
Airports
Sector Laws and Regulations
- The AAI Act, 1994 established the Airports Authority of India.
- The National Civil Aviation Policy, 2016, issued by the Ministry of Civil Aviation, focuses on strengthening air connectivity nationwide and rationalizing fares to be affordable to masses. Accordingly, the policy encourages the development of airports through public–private partnership (PPP) mode, with the AAI and the state governments contributing as public enterprises. In October 2016, the Ministry of Civil Aviation launched the “Ude Deshka Aam Naagrik” (UDAN) Regional Connectivity Scheme, which is a key component of the policy, to provide air connectivity to currently underserved and unserved airports, make air travel accessible to citizens, and stimulate regional connectivity through a market-based mechanism.
- The Airports Economic Regulatory Authority Act 2008 established a regulatory authority for major airports in India.
Key Entities
Agency Function Ministry of Civil Aviation - The MOCA is the apex entity for planning and development of the aviation sector.
- Site clearance for all greenfield airports is granted by the MOCA, based on the reports submitted by the AAI and the DGCA.
Airports Economic Regulatory Authority - Formed by Airports Economic Regulatory Authority Act, 2008, AERA is the regulatory authority for major airports in India.
- In 2019, the criterion for classifying a “major airport” was amended from the present.
- The minimum threshold to classify an airport as a "major airport" has increased from 1.5 million passengers per annum to 3.5 million passengers per annum. This came into force by amending the Airports Economic Regulatory Authority Act, 2008 into Airports Economic Regulatory Authority of India (Amendment) Act, 2019.
- AERA determines and regulates the tariff for aeronautical services and passenger service fees, airport security fees, user development fees, and other charges to monitor performance standards relating to quality, continuity, and reliability of services at major airports.
Airports Authority of India - The AAI was formed on 1 April 1995 by merging the International Airports Authority of India and the National Airports Authority to accelerate the integrated development, expansion, and the modernization of operational, terminal, and cargo facilities at the country’s airports, and make them conform to international standards.
- In accordance with the guidelines prescribed by the International Civil Aviation Organization, the MOCA publishes regulations for airport and airline operators to ensure safety and security of operations. The AAI is responsible for implementing the guidelines and monitoring compliance.
- The AAI is responsible for developing, financing, operating, and maintaining all public sector airports.
- The AAI acts as operator and regulator of airports and is the only body (except the Indian Air Force) empowered to provide air traffic services over the Indian airspace and adjoining oceanic areas, in accordance with the International Civil Aviation Organization standards.
- Communication, navigation, surveillance and air traffic management, and other allied infrastructure required for a greenfield airport will be mandatorily provided by the AAI.
Directorate General of Civil Aviation - The DGCA is the regulatory body primarily dealing with safety issues. It is responsible for regulating air transport services to, from, and within India and for enforcement of civil air regulations, air safety, and airworthiness standards. The DGCA also coordinates all regulatory functions with the International Civil Aviation Organization.
- The aerodrome licenses are granted by the DGCA.
Bureau of Civil Aviation Security (BCAS) - The BCAS is responsible for laying down standards and measures with respect to security of civil flights at international and domestic airports.
- Site clearance for all greenfield airports is granted by the MOCA, based on the reports submitted by the AAI and the DGCA.
Aircraft Accident Investigation Bureau - The AAIB has been mandated for immediate and unrestricted access to all relevant evidence related to investigation of accidents from any agency or organization without seeking prior consent from judicial bodies or other government authorities.
Ministry of Home Affairs and Ministry of Finance - Customs regulations are administered by the MOF, and immigration regulations are administered by the MHA.
- Clearance for customs-related services is issued by the MOF.
- The MHA issues licenses regarding the location of the airport, acquisition and installation of security equipment, and verification of developers’ credentials.
- Clearances for immigration-related services is issued by the MHA.
AAI = Airports Authority of India, AAIB = Aircraft Accident Investigation Bureau, AERA = Airports Economic Regulatory Authority, BCAS = Bureau of Civil Aviation Security, DGCA = Directorate General of Civil Aviation, MHA = Ministry of Home Affairs, MOCA = Ministry of Civil Aviation, MOF = Ministry of Finance.
Sources: Government of India, Ministry of Civil Aviation. Organizational Set Up; Government of India. Airports Economic Regulatory Authority of India; Government of India, Airports Economic Regulatory Authority of India. Airports Economic Regulatory Authority of India (Amendment) Act, 2019; Government of India. Airports Authority of India; and Government of India. Directorate General of Civil Aviation.
Foreign Investment Restrictions
COMPAREDOWNLOADParameter 2021 2022 2023 Maximum allowed foreign ownership of equity in greenfield projects 100% 100% 100% LEARN MOREAirports
Sector Laws and Regulations
Foreign Direct Investment Allowed in the Airport and Aviation Sector
Sector and Activity Percentage of Equity and FDI Cap Airports Sector - Greenfield projects
- Brownfield projects
100% (Automatic route)
100% (Automatic route)Air Transport Services - Scheduled air transport services and scheduled domestic passenger airlines
- Regional air transport services
- Nonscheduled air transport services
- Helicopter services and seaplane services requiring DGCA approval
Automatic up to 49% (Automatic up to 100% for NRIs), Government route beyond 49% 100% (Automatic route) Other Services in Aviation Sector - Ground handling services subject to sector regulations and security clearance
- Maintenance and repair organizations, flying training institutes, and technical training institutes
100% (Automatic route)
100% (Automatic route)
DGCA = Directorate General of Civil Aviation, FDI = foreign direct investment, NRI = nonresident Indian.
Source: Government of India, Ministry of Commerce and Industry, Department for Promotion of Industry and Internal Trade. 2020. Consolidated FDI Policy.
Standard contracts
COMPAREDOWNLOADType of contract Availability PPP/concession agreement Performance-based operation and maintenance contract Engineering, procurement, and construction contract - Yes
LEARN MOREAirports
Sector Laws and Regulations
The two largest airports given for private sector participation were the brownfield airports of Mumbai and New Delhi, while the next largest airports were greenfield projects of Bengaluru and Hyderabad. All of these airports had their concession agreements signed. All the four airports were either awarded purely on revenue share model or upfront fees plus revenue share model. The tariff was regulated and reviewed at periodic intervals.
In 2018, the Ministry of Civil Aviation shifted away from revenue share as a bid parameter and proposed the following model for the selection of developers for greenfield airports in the country:
- The maximum blended aeronautical yield in terms of Indian rupee per passenger shall be predetermined by the Concession Authority at the beginning of the concession period. It shall undergo minor adjustments to account for inflation and certain eventualities over the concession period.
- The maximum blended aeronautical yield for greenfield airports for FY2019 was proposed to be ₹400 per passenger. The number has been arrived at based on projected cash flow analysis for greenfield airports of different capacities and a review of aeronautical yields at Indian and global airports in the past.
- The bid parameter is proposed to be the “concession fee per passenger” payable to the Concession Authority in terms of Indian rupee per passenger. The bids will differ for each airport in line with its projected traffic, financial returns, and risk profile.
- The concession period was proposed to be 40 years.1
- 1Government of India, Press Information Bureau. 2018. Ministry of Civil Aviation: New Transaction Structure for Future Greenfield Airports Proposed Under Nabh Nirmaan 2018. Press release. 14 August.
Airports
Sector Master Plan
The AAI has earmarked 25 airports for leasing. It has already leased out eight of its airports through the PPP model. The AAI Board recommended leasing out six airports (Amritsar, Bhubaneswar, Indore, Raipur, Trichy, and Varanasi) for operation, management, and development under PPP. These facilities are managed by the state-owned AAI and witnessed traffic between 1.04 million and 2.52 million passengers in FY2022–2023.
In February 2019, the Ministry of Civil Aviation bid out six profit-making airports (Ahmedabad, Guwahati, Jaipur, Lucknow, Mangalore, and Thiruvananthapuram) based on highest per-passenger fee offered to the AAI. One of the leading private developers in the country won the rights to operate, manage, and develop these airports for a period of 50 years.
The table shows the expected investments over the next 5 years, based on the National Infrastructure Pipeline.
Estimated Capital Expenditure Plan for the Airport Sector Under the National Infrastructure Pipeline
Project Category No. of Projects Capital Expenditure, FY2020–FY2025 ($ billion) (₹ billion) Greenfield airports 8 4.41 361.47 Expansion and modernization of existing airports 50 6.47 530.20 Total 58 10.88 891.67 FY = fiscal year.
Source: Government of India, Ministry of Finance, Department of Economic Affairs. 2019. National Infrastructure Pipeline. Volume 2.
Projects under Preparation and Procurement
Airports Public-Private Partnerships under Preparation and Procurement
COMPAREDOWNLOADNotes:
1. The hyphen symbol (-) means data are not available.
2. Projects under conceptualization and development have been extracted from the India Investment Grid website. The website serves as a repository of a list of projects under the National Infrastructure Pipeline (NIP), which is constantly updated and provides attractive investment opportunities. The website also features the non-NIP, which includes additional project opportunities collated by the India Infrastructure Grid.
Source: Government of India, Ministry of Commerce and Industry, Department for Promotion of Industry and Internal Trade, India Investment Grid. Projects under NIP and Non-NIP (accessed 15 July 2023).
Airports
Features of Past PPP Projects
Procurement of PPP Projects
Airports Public-Private Partnerships procured through various modes
COMPAREDOWNLOADNotes: Only active and concluded projects are considered in the graph. Information on four projects (up to 2022) is either not available or not applicable, according to the database, and is therefore excluded. The hyphen symbol (-) means data are not available.
Source: World Bank. Infrastructure Finance, PPPs and Guarantees. Custom Query (accessed 3 January 2024).
PPP Projects Reaching Financial Close
Airports Public-Private Partnerships reaching Financial Close
COMPAREDOWNLOADPPP = public–private partnership.
Note: Only active and concluded projects are considered in the graph.
Source: World Bank. Infrastructure Finance, PPPs and Guarantees. Custom Query (accessed 3 January 2024).
PPP Projects with Foreign Sponsor Participation
Airports Public-Private Partnerships with Foreign Sponsor Participation
COMPAREDOWNLOADPPP = public–private partnership.
Notes: Only active and concluded projects are considered in the graph. Information on three projects (1990–2022) is either partially available or not available and, hence, excluded.
Source: World Bank. Infrastructure Finance, PPPs and Guarantees. Custom Query (accessed 3 January 2024).
Government Support to PPP Projects
Government Support for Airports Public-Private Partnerships
COMPAREDOWNLOADNotes: Only active and concluded projects are considered in the graph. The hyphen symbol (-) means there are no projects in the sector, data are unavailable or not applicable, according to the database.
Source: World Bank. Infrastructure Finance, PPPs and Guarantees. Custom Query (accessed 3 January 2024).
Payment Mechanism for PPP Projects
Payment Mechanisms for Airports Public-Private Partnerships
COMPAREDOWNLOADNotes: Only active and concluded projects are considered in the graph. The hyphen symbol (-) means there are no projects in the sector, data are unavailable or not applicable, according to the database. Information on seven projects (up to 2020) is not applicable, according to the database, and is therefore excluded.
Source: World Bank. Infrastructure Finance, PPPs and Guarantees. Custom Query (accessed 3 January 2024).
The table shows the past PPP projects in the airport sector classified in terms of PPP variant or scheme, based on the Department of Economic Affairs (DEA) database.
Number of Airport Projects Across Public–Private Partnership Variants
Public–Private Partnership Variant No. of Projects Build–own–operate 1 Build–own–operate–transfer 4 Design–build–finance–operate 1 Design–build–finance–operate–transfer 1 Not available 2 Operation, management, and development agreement 2 Total 11 Note: Data was last updated on 5 December 2019.
Source: Government of India, Ministry of Finance, Department of Economic Affairs. List of All PPP Projects (accessed 15 July 2023).
Typical Risk Allocation for PPP Projects
COMPAREDOWNLOADType of Risk Private Public Shared Comment Demand Tariff Tariff is regulated. Environment and social Land acquisition Political Foreign exchange (FOREX) Financing risk Construction risk Competition risk (exclusivity) No new airport permission within 150 kilometers of aerial distance for 25 years from start of operations Permits Force majeure risk - Yes
Financing Details
Parameter 1990–2021 1990–2022 1990–2023 PPP projects with foreign lending participation UA UA UA PPP projects that received export credit agency/international financing institution support UA UA UA Typical debt:equity ratio (70–80) : (30–20) Time for financial close 3 months extendable by mutual consent Typical concession period 30 years Typical financial internal rate of return UA PPP = public–private partnership, UA = unavailable.
Source: World Bank. Infrastructure Finance, PPPs and Guarantees. Custom Query (accessed 3 January 2024).
Airports
Tariffs
In 2011, the regulator for major airports issued directions to determine the tariff for airport operators and service providers. These included
- Airports Economic Regulatory Authority of India (Terms and Conditions for Determination of Tariff for Airport Operators) Guidelines, 2011; and
- Airports Economic Regulatory Authority of India (Terms and Conditions for Determination of Tariff for Services Provided for Cargo Facility, Ground Handling, and Supply of Fuel to the Aircraft) Guidelines, 2011.
The user charges levied by the major airports for aeronautical services are determined based on the provisions of the Government Support Agreement and are periodically reviewed by the Airports Economic Regulatory Authority based on the return of capital employed earned by the concessionaire or special purpose vehicle (SPV) for each control period, and the multiyear tariff proposal submitted by the concessionaire or the SPV. The major airports must submit to the regulator a schedule of charges and investments in their Regulated Asset Base. The regulator then determines the charges based on a guaranteed return on the Regulator Asset Base factoring in the cost of capital, depreciation, operation and maintenance (O&M), and taxes.1
However, the Airports Economic Regulatory Authority of India (Amendment) Act, 2019 (an amendment to the Airports Economic Regulatory Authority of India Act, 2008) has added a clause indicating that in case tariffs are pre-incorporated into the bidding documents, after approval by Airports Economic Regulatory Authority, the Authority shall not determine any tariffs for such projects during the operations period. The amendment in the Act states:
Notwithstanding anything contained in subsections (1) and (2), the Authority shall not determine the tariff or tariff structures or the amount of development fees in respect of all airport or part thereof, if such tariff or tariff structures or the amount of development fees has been incorporated in the bidding document, which is the basis for award of operatorship of that airport;
Provided that the Authority shall be consulted in advance regarding the tariff, tariff structures, or the amount of development fees proposed to be incorporated in the said bidding document and such tariff, tariff structures, or the amount of development fees shall be notified in the Official Gazette.2
The Joint Venture Committee or the SPV is free to fix the charges for non-aeronautical services, subject to the applicable law and provisions in the development and maintenance contracts.
The Airports Economic Regulatory Authority of India (Amendment) Act, 2021 allows tariff determination of a “group of airports” by way of amending the definition of “major airport.” The bill amends the provisions of the law in relation to tariffs for single airports.3
- 1Government of India, Airports Economic Regulatory Authority of India. Directions/Guidelines.
- 2Government of India. 2019, The Airports Economic Regulatory Authority of India (Amendment) Act, 2019. The Gazette of India. 24 September
- 3Government of India. 2021. The Airports Economic Regulatory Authority of India (Amendment) Bill, 2021.
Airports
Challenges
- While the cost of land acquisition for greenfield projects can be a challenge, it also presents an opportunity for innovative solutions and partnerships. The implementation of newer laws on compensation in land acquisition, although making projects seem unaffordable, ensures fair compensation and could lead to better growth and development.
- Airport companies have the potential to generate substantial returns over the concession period. This potential has motivated them to invest significantly in creating airport megastructures. While these costs have raised concerns when passed on to airport users, they also highlight the importance of strategic planning and proportionate spending. Addressing these concerns could lead to more efficient capital expenditure and improved user satisfaction.
- Delays in securing necessary clearances and approvals can lead to project delays and cost overruns. However, these challenges underscore the importance of efficient project management and the potential benefits of streamlining the approval process. Overcoming these obstacles could result in timely project completion and cost efficiency.
-
Energy
-
Power Consumption
1,327 kWh per capita
-
Share of Clean Energy
43 %
-
Electricity Access
99.6 %
-
Energy Imports
----
-
Number of PPPs Reaching FC
566
-
Value of PPPs Reaching FC
157,569
-
Number of PPPs with Foreign Sponsors
130
-
Number of PPPs with Govt. Support
109
FC = financial closure, Govt. = government, kWh = kilowatt-hour.
Note: Share of clean energy and energy imports as percentage of total energy use. Energy access as percentage of total population.
Sources: Government of India, Ministry of Power, Central Electricity Authority. 2023. Growth of Electricity Sector in India from 1947 to 2023; Government of India, Press Information Bureau. 2022. Renewable Energy in India. 9 September; World Bank. Access to Electricity: India (accessed 15 July 2023); Invest India. Renewable Energy (accessed 15 July 2023); The Global Economy. Share of Clean Energy—Country Rankings (accessed 15 July 2023); and United Nations, Department of Economic and Social Affairs. 2019. Energy Statistics Pocketbook.
Energy
Contracting Agencies
In India, there are different authorities for the power sector and for the oil and gas sector.
Power
The Ministry of Power is an apex organization under the central government, which formulates and administers the energy sector program in consultation with other central ministries and departments. The Ministry of Power is a holding body for generation (tariff regulation), scheduling and dispatching, transmission, and distribution.
Oil and Gas
The Ministry of Petroleum and Natural Gas is an apex organization under the central government. Its major functions include (i) exploration, production, refining, distribution and marketing, and import and export of oil and natural gas; and (ii) conservation of petroleum products and liquefied natural gas.
Energy
Sector Laws and Regulations
Power
The power sector in India is mainly governed by the Electricity Act, 2003 (amended in 2007), which seeks to create a liberal framework for developing this sector. Some of its salient features include the following:
- De-licensing of generation and free permission for captive generation;
- Open access in transmission to be provided to distribution licensees and generation companies;
- Open access in distribution to be allowed by state electricity regulatory commissions (SERCs) in phases;
- Trading to be recognized as a distinct activity and the regulatory commissions as the authority in safeguarding it by fixing ceiling on trading margins; and
- The follow-on policy to include the National Tariff Policy 2006, which assures customers of electricity at reasonable rates and competitive price—this policy was amended into the Revised Tariff Policy, 2016 to ensure the financial viability of the sector, attract investments, and minimize regulatory risks.
The Ministry of Power amended the Electricity Act, 2003 through the Electricity (Amendment) Bill, 2022. The Electricity Bill (4th proof says Act), 2022 specifies the following:1
- Provide for the constitution of the Electricity Contract Enforcement Authority, which will have the sole authority to adjudicate upon specified contract-related disputes in the electricity sector.
- Constitute a common selection committee to select the chairperson and members of the Appellate Tribunal, the central and state regulatory commissions, and the Electricity Contract Enforcement Authority.
- Increase the number of members (including the chairperson) in SERCs from three to four. Further, at least one member in both the Central Electricity Regulatory Commission (CERC) and SERCs must have background in law.
- Authorize the State Commission to determine the floor and ceiling tariffs for retail supply, if there is more than one discom in an area.
- Set up a cross-subsidy balancing fund by the state government to deposit surplus of cross-subsidy from one discom, and to provide for any deficit of another discom in the same or any other area.
- Empower the CERC and SERCs to adjudicate disputes related to the performance of contracts. These refer to contracts related to the sale, purchase, or transmission of electricity.
The Ministry of Power issued a notification dated 30 June 2023 introducing the Electricity (Amendment) Rules, 2023(Amendment Rules), which has changed the provisions relating to captive generating power plants.2 The Amendment Rules provide that if a captive generating plant is established by an affiliate company, then the captive user must hold no less than 51% of ownership in that affiliate company, instead of the earlier 26%.
Renewable Energy
The Ministry of New and Renewable Energy (MNRE) is the nodal ministry of the Government of India for all matters relating to new and renewable energy. The MNRE aims to develop and deploy new and renewable energy to supplement the energy requirements of the country. Its main function is to facilitate research, design, development, manufacturing, and deployment of new and renewable energy systems and/or devices for transportation, as well as portable and stationary applications in rural, urban, industrial, and commercial sectors. It focuses on solar, wind, small hydro, and biofuel projects.
The MNRE leads the country’s efforts toward achieving 40% of installed power generation capacity from non-fossil fuel sources and reducing emission intensity of greenhouse gases by 33% to 35% from the 2005 level by 2030.
In 2018, the ministry provided a notification on the National Wind-Solar Hybrid Policy, which aims to “provide a framework for promotion of large grid connected wind-solar photovoltaic (PV) hybrid system for efficient and optimal utilization of wind and solar resources, land and transmission infrastructure.” The policy encourages “new technologies, methods and wayouts involving combined operation of wind and solar PV plants and seeks to promote new hybrid projects as well as hybridization of existing wind and solar projects.”3
The Government of India revised the Solar Mission in 2014. It targets 100-gigawatt (GW) installed capacity of solar electricity by 2022. As of March 2023, India generated 16.1% of its total energy through solar power.4
In 2023, the Government of India launched the National Green Hydrogen Mission, with an outlay of ₹197.44 billion up to FY 2029-2030. It will contribute to India’s goal to become Aatma Nirbhar (self-reliant) through clean energy as well as toward for the global clean energy transition. The Mission will lead to significant decarbonization of the economy, reduced dependence on fossil fuel imports, and enable India to assume technology and market leadership in green hydrogen.5
Oil and Gas
The oil and gas sector is governed by the Petroleum and Natural Gas Regulatory Board Act, 2006, which regulates the refining, storage, transportation, distribution, and marketing of petroleum products, excluding the production of crude oil and natural gas. The sector has the following key elements:
- The open acreage policy enables private participants to come up with proposals for exploration and development of fields not identified by the government.
- Other policies include New Hydrocarbon Exploration and Licensing Policy and Small Fields Policy (March 2016) for monetization of 67 discoveries through international competitive bidding. New gas pricing formula linked to the global market was made effective from November 2014.
- The Petroleum and Minerals Pipeline Act, 1962 governs the laying of pipelines for transport of petroleum and minerals. The Petroleum Act, 1934 governs the importation, transportation, storage, production, refining, and blending of petroleum, and deals substantially with midstream activities of petroleum. The Oil Fields Act, 1948 is the basic statute for licensing and leasing of petroleum and gas blocks by the Government of India, empowering the government with the broad authority to make rules providing for the basic regulation of oil fields and for the development of mineral oil resources. Along with the Petroleum Rules, 2002, the Oilfields (Regulation and Development) Act, 1948 governs the grant of production exploration licenses and mining leases.
- The Policy on Shale Gas and Oil, 2013 allows companies to apply for shale gas and oil rights with their petroleum exploration licenses and petroleum mining leases.
State initiatives for renewable energy include the following:
- SERCs in Andhra Pradesh, Gujarat, Haryana, Kerala, Madhya Pradesh, Maharashtra, Odisha, Punjab, Rajasthan, Tamil Nadu, and West Bengal have announced preferential tariffs for purchase of power from wind power projects;
- New Solar Policy (2016) for Delhi, Haryana, and Himachal Pradesh; and
- New Solar Policy (2015) for Andhra Pradesh, Gujarat, Jharkhand, and Telangana.
Below table describes the functions of regulatory authorities in the energy sector.
- 1PRS Legislative Research. 2022. Electricity (Amendment) Bill, 2022.
- 2Government of India. 2023. Electricity (Amendment) Bill, 2022.
- 3Government of India, Ministry of New and Renewable Energy. 2018. National Wind-Solar Hybrid Policy, 2018.
- 4Government of India, Ministry of Power. 2023. Power Sector at a Glance. .
- 5Government of India, Ministry of New and Renewable Energy, Press Information Bureau. 2024. 24. Government Issues Scheme Guidelines for Pilot Projects on Use of Green Hydrogen in the Transport Sector. Press release. 14 February.
Regulatory Entities
Agency Functions (Indicative List) Central Electricity Regulatory Commission (CERC) Handles regulation at the central power market level under the mandates of the Electricity Act of 2003. The CERC determines the tariffs for generators owned by the central government and for those supplying electricity to more than one state. It sets the tariffs for transmission and is also in charge of licensing interstate transmission and trading by generators, grid discipline and grid security, market development and market monitoring, and promotion of renewable energy and energy efficiency by regulating renewable energy certificates and energy saving certificates. The CERC also has oversight over the two power exchanges—the Indian Energy Exchange and the Power Exchange India. The Central Advisory Committee is in place to advise the CERC on policy questions, compliance of power market licensees, and standards of performance by utilities; however, it has no direct policy or regulatory control. Petroleum and Natural Gas Regulatory Board Assists the Ministry of Petroleum and Natural Gas in storing, transporting, distributing, and marketing petroleum, petroleum products, and natural gas, excluding the production of crude oil and natural gas. Directorate General of Hydrocarbons (DGH) Promotes sound management of the oil and natural gas resources with a balanced regard for the environment, safety, and technological and economic aspects of the petroleum industry—under the Ministry of Petroleum and Natural Gas. The DGH also regulates the exploration and optimal exploitation of hydrocarbons. State Electricity Regulatory Commissions (SERCs) Regulates the electricity generated by individual state’s generators and sold within a single state. SERCs grant licenses for intrastate transmission, trading, and distribution. The Government of India is planning a national-level selection committee for appointing chairpersons and members in all SERCs to set the bodies free from political intervention and improve decision-making at the central level. Forum of Regulators of India Brings together the CERC and the SERCs in a forum to discuss and exchange views around model guidelines or regulations (model guidelines on rooftop solar and net metering rules, tariff rationalization, and tariff guidelines). Sources: Government of India. Central Electricity Regulatory Commission; Government of India. Petroleum and Natural Gas Regulatory Board; and Government of India, Ministry of Petroleum and Natural Gas. Directorate General of Hydrocarbons.
Foreign Investment Restrictions
COMPAREDOWNLOADParameter 2021 2022 2023 Maximum allowed foreign ownership of equity in greenfield projects Power generation
100% 100% 100% Power transmission
100% 100% 100% Power distribution
100% 100% 100% Oil and gas
100% 100% 100% LEARN MOREEnergy
Sector Laws and Regulations
A foreign direct investment of up to 49% is allowed in the following:
- power exchanges and automatic routes under the Central Electricity Regulatory Commission, and
- petroleum and natural gas refining sector (for public sector undertakings without involving any disinvestment or dilution of domestic equity).
Standard Contracts
COMPAREDOWNLOADType of contract Availability PPP/concession agreement Power purchase agreement Capacity take-or-pay contract Fuel supply agreement Transmission and use of system agreement Performance-based operation and maintenance contract Engineering, procurement, and construction contract - Yes
- No
Source: Asian Development Bank. 2019. Public–Private Partnership Monitor. Second Edition.
Energy
Sector Master Plan
The Make in India campaign, launched in September 2014, has proposed a massive infrastructure development program for the energy sector. The program comprises the following:
- Setting up of ultra-mega power projects of 4,000-megawatt capacity each. The Power Finance Corporation has been identified as the nodal agency for ultra-mega power projects with likely investment of $27.39 billion (₹2 trillion).
- Investing $114.87 billion (₹8.2 trillion) for thermal power projects and $2.64 billion (₹193 billion) for hydropower projects. Investment in the transmission line sector is proposed at $8.01 billion (₹584.5 billion) and includes Green Corridor I ($1.28 trillion or ₹93.2 trillion), Green Corridor II ($0.55 billion or ₹40.3 billion), tariff-based competitive bidding ($1.58 billion or ₹115.2 billion), and a scheme totaling $4.60 billion (₹335.8 billion) to be awarded by the power grid.
- Adding 175 GW of renewable energy generation capacity by 2022. As of February 2023, the total installed renewable energy capacity reached 168.96 GW.1
- Attracting investments, such as expansion plans for 23 refineries, and tapping foreign investment in export-oriented infrastructure, including product pipelines and export terminals.
An overall total capital expenditure of ₹1.95 trillion ($26.71 billion) by the central and state governments would be made over FY2020 through FY2025 on 163 projects in petroleum and natural gas sectors, identified for implementation during the period. Of these, only two projects with an estimated expenditure of ₹107.51 billion ($1.47 billion) have been earmarked for public–private partnership (PPP) while the remaining would be on engineering, procurement, and construction (EPC) model.
The tables below show the planned investments in the power sector, according to the NIP. In the power sector, an estimated total capital expenditure of ₹14.10 trillion ($172.05 billion) by both the central and state governments would be incurred over FY2020–FY2025. Below table shows the breakdown of the total estimated expenditure of ₹9.54 trillion ($116.37 billion) for the identified projects to be executed by central public sector units and private players.
- 1The Economic Times. 2023. India’s Renewable Energy Capacity Reaches 168.96 GW till Feb 2023: Minister R K Singh. 21 March.
Capital Expenditure Plan for the Energy Sector by Segment, Based on the National Infrastructure Pipeline
Project Category Capital Expenditure, FY2020-FY2025 ($ billion) (₹ billion) Generation 39.86 3,268.11 NTPC 14.64 1,199.99 NHPC 5.37 440.49 THDC 1.27 103.85 SJVN 1.26 103.34 DVC 0.35 28.48 State (Hydro) 9.19 753.75 Private (Hydro) 7.79 638.29 Distribution 39.40 3,230.34 DDUGJY, IPDS, Proposed New Scheme 39.40 3,230.34 Transmission 37.09 3,040.50 PGCIL 7.99 655.00 DVC 0.07 5.49 State 23.18 1,900.01 Private 5.86 480.00 Subtotal 116.36 9,538.95 States 55.69 4,565.33 Total 172.05 14,104.28 DDUGJY = Deen Dayal Upadhyaya Gram Jyoti Yojana, DVC = Damodar Valley Corporation, FY = fiscal year, IPDS = Integrated Power Development Scheme, NHPC = National Hydroelectric Power Corporation, NTPC = National Thermal Power Corporation Limited, PGCIL = Power Grid Corporation of India Limited, SJVN = Satluj Jal Vidut Nigam, THDC = Tehri Hydro Development Corporation.
Note: Numbers may not sum precisely because of rounding.
Source: Government of India, Ministry of Finance, Department of Economic Affairs. 2019. National Infrastructure Pipeline. Volume 2.
Estimated Year-on-Year Capital Expenditure Plan in the Energy Sector, Based on the National Infrastructure Pipeline
Project Category FY2020 FY2021 FY2022 FY2023 FY2024 FY2025 Total Generation ₹ billion 300.56 538.19 637.89 634.74 649.82 506.90 3,268.11 $ billion 3.67 6.56 7.78 7.74 7.93 6.18 39.86 Distribution ₹ billion 211.27 420.00 442.07 600.00 700.00 857.00 3,230.34 $ billion 2.58 5.12 5.39 7.32 8.54 10.45 39.40 Transmission ₹ billion 548.75 538.97 507.12 515.22 515.22 415.22 3,040.50 $ billion 6.69 6.57 6.19 6.28 6.28 5.06 37.09 Subtotal ₹ billion 1,060.58 1,497.16 1,587.08 1,749.96 1,865.04 1,779.12 9,538.95 $ billion 12.94 18.26 19.36 21.35 22.75 21.70 116.36 States ₹ billion 580.81 758.34 630.27 484.91 387.32 330.90 4,565.33 $ billion 7.08 9.25 7.69 5.91 4.72 4.04 55.69 Total ₹ billion 1,641.40 2,255.51 2,217.34 2,234.87 2,252.36 2,110.02 1,4104.28 $ billion 20.02 27.51 27.05 27.26 27.47 25.74 172.05 FY = fiscal year
Note: Numbers may not sum precisely because of rounding.
Source: Government of India, Ministry of Finance, Department of Economic Affairs. 2019. National Infrastructure Pipeline. Volume 1.
Renewable Power Plans
The project categories included are solar, wind, small hydro, and biopower. The capital expenditure for these projects is estimated at ₹9.3 trillion ($113.38 billion). A summary of the projects is highlighted in the below table.
Capital Expenditure Plan for the Renewable Energy Sector, Based on the National Infrastructure Pipeline
Project Category Target by Dec 2025 (GW) Actual Achievement Until Mar 2023 (GW) Capacity to Be Added by FY2025 (GW) Capital Expenditure, FY2020–FY2025 ($ billion) (₹ billion) Solar power 149.70 66.78 118.00 57.58 4,720.00 Wind power 96.99 42.63 59.90 51.15 4,193.00 Small hydropower 7.00 4.94 2.35 2.87 235.00 Biopower 12.04 10.24 2.10 1.79 147.00 Total renewables 265.73 124.59 182.35 113.38 9,295.00 Year-wise Capital Expenditure FY2020 FY2021 FY2022 FY2023 FY2024 FY2025 Total ₹ billion 305.0 1,510.0 1,440.0 1,700.0 2,170.0 2,170.0 9,295.0 $ billion 3.72 18.42 17.57 20.74 26.47 26.47 113.38 FY= fiscal year, GW = gigawatt.
Note: Numbers may not sum precisely because of rounding.
Sources: Government of India, Ministry of Finance, Department of Economic Affairs. 2019. National Infrastructure Pipeline. Volume 2; and Government of India, Ministry of Power, Central Electricity Authority, Renewable Project Monitoring Division. 2023. Monthly Renewable Energy Generation Report.
Total Year-on-Year Capital Expenditure Plan for the Energy Sector in India
Below table summarizes the total energy sector capital expenditure to be incurred from FY2020 to FY2025.
Project Category FY2020 FY2021 FY2022 FY2023 FY2024 FY2025 Phasing Not Provideda Total Power ₹ billion 1,641.40 2,255.51 2,217.34 2,234.87 2,252.36 2,110.02 14,104.28 1,641.40 $ billion 20.02 27.51 27.05 27.26 27.47 25.74 172.05 20.02 Renewable energy ₹ billion 305.00 1,510.00 1,440.00 1,700.00 2,170.00 2,170.00 9,295.00 305.00 $ billion 3.72 18.42 17.57 20.74 26.47 26.47 113.38 3.72 Atomic energy ₹ billion 116.35 214.62 283.24 331.24 326.74 282.84 1,555.03 116.35 $ billion 1.42 2.62 3.45 4.04 3.99 3.45 18.97 1.42 PNG ₹ billion 273.32 435.10 483.14 415.23 228.58 105.35 1,945.72 273.32 $ billion 3.33 5.31 5.89 5.07 2.79 1.29 23.73 3.33 Total ₹ billion 2,336.07 4,415.22 4,423.72 4,681.34 4,977.68 4,668.21 26,900.03 2,336.07 $ billion 28.50 53.86 53.96 57.10 60.72 56.94 328.13 28.50 - aExpenditure plan for which phasing details are not defined.
FY = fiscal year, PNG = petroleum and natural gas.
Note: Numbers may not sum precisely because of rounding.
Source: Government of India, Ministry of Finance, Department of Economic Affairs. 2019. National Infrastructure Pipeline. Volume 2.
Projects under Preparation and Procurement
Energy Public-Private Partnerships under Preparation and Procurement
COMPAREDOWNLOADSource: Government of India, Ministry of Commerce and Industry, Department for Promotion of Industry and Internal Trade, India Investment Grid. Projects under NIP and Non-NIP (accessed 15 July 2023).
Energy
Features of Past PPP Projects
Procurement of PPP Projects
Energy Public-Private Partnerships procured through various modes
COMPAREDOWNLOADNotes: Only active and concluded projects are considered in the graph. A total of 41 projects awarded on license/franchise basis are included in the competitive bids category. Information on 153 projects (up to 2022) is either not available or not applicable, according to the database, and is therefore excluded.
Source: World Bank. Infrastructure Finance, PPPs and Guarantees. Custom Query (accessed 3 January 2024).
PPP Projects Reaching Financial Close
Energy Public-Private Partnerships reaching Financial Close
COMPAREDOWNLOADPPP = public–private partnership.
Note: Only active and concluded projects are considered in the graph.
Source: World Bank. Infrastructure Finance, PPPs and Guarantees. Custom Query (accessed 3 January 2024).
PPP Projects with Foreign Sponsor Participation
Energy Public-Private Partnerships with Foreign Sponsor Participation
COMPAREDOWNLOADPPP = public–private partnership.
Notes: Only active and concluded projects are considered in the graph. Information on 61 projects (1990–2022) is either partially available or not available and, hence, excluded.
Source: World Bank. Infrastructure Finance, PPPs and Guarantees. Custom Query (accessed 3 January 2024).
Government Support to PPP Projects
Government Support for Energy Public-Private Partnerships
COMPAREDOWNLOADNote: Only active and concluded projects are considered in the graph.
Source: World Bank. Infrastructure Finance, PPPs and Guarantees. Custom Query (accessed 3 January 2024).
Payment Mechanism for PPP Projects
Payment Mechanisms for Energy Public-Private Partnerships
COMPAREDOWNLOADNotes: Only active and concluded projects are considered in the graph. Information on 125 projects (up to 2022) is not applicable, according to the database, and is therefore excluded.
Source: World Bank. Infrastructure Finance, PPPs and Guarantees. Custom Query (accessed 3 January 2024).
Below table shows the past PPP projects in the energy sector classified in terms of PPP variant or scheme, based on the Department of Economic Affairs (DEA) database.
Number of Energy Projects Across Public–Private Partnership Variants
Public–Private Partnership Variant No. of Projects Build–operate–transfer 58 Build–own–operate 126 Build–own–operate–manage 44 Build–own–operate–transfer 205 Design–build–finance–operate–transfer 9 Design–build–finance–operate–transfer (toll) 1 DTR secondary side maintenance and RPU-based franchisee 1 Input-based distribution franchisee 5 Licensee model 6 Management contract (O&M) 1 Not available 11 Rehabilitate–operate–maintain–transfer 2 Total 469 DTR = distribution transformer, O&M = operation and maintenance, RPU = revenue realization per unit.
Note: Data was last updated on 5 December 2019.
Source: Government of India, Ministry of Finance, Department of Economic Affairs. List of All PPP Projects (accessed 15 July 2023).
Below table indicates the number of projects across various energy subsectors, according to the DEA database.
Number of Energy Projects Based on Subsectors
Subsector No. of Projects Electricity distribution 16 Electricity generation (grid) 79 Electricity transmission 34 Oil, gas, liquefied natural gas storage 1 Renewable energy (grid) 339 Total 469 Note: Data was last updated on 5 December 2019.
Source: Government of India, Ministry of Finance, Department of Economic Affairs. List of All PPP Projects (accessed 15 July 2023).
Typical Risk Allocation
COMPAREDOWNLOADType of Risk Private Public Shared Comments Demand risk Revenue collection risk Tariff risk Government payment risk Environmental and social risk Land acquisition risk Permits Handover risk Political risk Regulatory risk Interconnection risk Brownfield risk: asset condition Grid performance risk Hydrology risk Exploration and drilling risk - Yes
Source: Asian Development Bank. 2019. Public–Private Partnership Monitor. Second Edition.
Financing Details
Parameter 1990–2020 1990–2021 1990–2022 Public–private partnership (PPP) projects with foreign lending participation 48 54 58 PPP projects that received export credit agency/international financing institution support 64 66 68 Typical debt-to-equity ratio 70:30 Time for financial close UA Typical concession period 25 years Typical financial internal rate of return UA Energy
Tariffs
The implementing and regulating agency, the Central Regulatory Electricity Commission, will carry out the regulatory functions for PPP power projects. The Tariff Policy, 2006 sets directives for the various aspects of power project development, such as the requirements for competitive bidding, rates of return for power projects, financing limits in relation to debt-to-equity ratios, and depreciation rates for power assets.
For renewable energy, the policy requires that each state electricity regulator specify a time-bound renewable purchase obligation with distribution companies and establish preferential tariffs for the purchase of electricity from nonconventional technologies. In January 2016, the central government approved amendments to the tariff policy to increase statewide renewable purchase obligation targets to 17% by 2022, including a minimum of 8% provision for solar energy (from the previous target of 3%). In June 2023, the Government of India introduced two changes to the prevailing power tariff system through an amendment to the Electricity (Rights of Consumers) Rules, 2020. These changes are the introduction of a Time of Day Tariff, and the rationalization of smart metering provisions.
The Petroleum Planning and Analysis Cell, along with the Ministry of Petroleum and Natural Gas, regulates the tariff for petroleum and petroleum products, including hydrocarbon.
The applicable tariffs for power plants based on the “Determination of levelized generic tariff for FY2022–FY2023 under Regulation 8 of the Central Electricity Regulatory Commission (Terms and Conditions for Tariff Determination from Renewable Energy Sources) Regulations, 2020” are listed in below table. The Central Electricity Regulatory Commission uses a normative approach for arriving at the tariff and provides the necessary variations required to differentiate the norms or factors used for determining the tariff from state to state.
Tariffs Set Up by the Central Electricity Regulatory Commission for Energy Projects in India
IPP Type Nature of Facility Levelized Total Tariff, FY2022–FY2023 (₹/kWh) Levelized Total Tariff, FY2022–FY2023 ($ cent/kWh) Solar thermal Project-specific Project-specific Solar PV Project-specific Project-specific Wind Project-specific Project-specific Small hydropower Himachal Pradesh, Uttarakhand, West Bengal, and Northeastern States (below 5 MW) 5.23 6.28 Himachal Pradesh, Uttarakhand, West Bengal, and Northeastern States (5 MW to 25 MW) 4.76 5.71 Other states (below 5 MW) 5.84 7.01 Other states (5 MW to 25 MW) 5.76 6.72 Biomassa Biomass power projects (other than rice straw and juliflora [plantation]-based project) with water-cooled condenser and travelling grate boiler 8.10 9.72 Biomass power projects (other than rice straw and juliflora [plantation]-based project) with air-cooled condenser and travelling grate boiler 8.36 10.03 Biomass power projects (rice straw and juliflora [plantation]-based project) with water-cooled condenser and travelling grate boiler 8.20 10.00 Biomass power projects (rice straw and juliflora [plantation]-based project) with air-cooled condenser and travelling grate boiler 8.46 10.32 Biomass power projects (other than rice straw and juliflora [plantation]-based project) with water-cooled condenser and AFBC boiler 8.00 9.76 Biomass power projects (other than rice straw and juliflora [plantation]-based project) with air-cooled condenser and AFBC boiler 8.25 10.06 Biomass power projects (rice straw and juliflora [plantation]-based project) with water-cooled condenser and AFBC boiler 8.09 9.87 Biomass power projects (rice straw and juliflora [plantation]-based project) with air-cooled condenser and AFBC boiler 8.35 10.19 Bagasse based co-generation project 6.43 7.84 Biomass gasifier power project 7.76 9.36 Biogas 8.59 10.48 - aNet levelized tariff (upon adjusting for accelerated depreciation benefit, if availed); tariff for all modes other than small hydropower is indicated for the state of Andhra Pradesh.
AFBC = atmospheric fluidized bed combustion, FY = fiscal year, IPP = independent power producer, kWh = kilowatt-hour, MW = megawatt, PV = photovoltaic.
Source: Central Electricity Regulatory Commission. 2022. Generic Tariff for RE Technologies for FY 2022–23.
In accordance with Regulation 7 of the Renewable Energy Tariff Regulations, the Central Electricity Regulatory Commission shall determine project-specific tariff for the following renewable energy technologies:
- solar PV and solar thermal;
- wind energy (including onshore and offshore);
- biomass-gasifier-based projects, when a project developer opts for project-specific tariff;
- biogas-based projects, when a project developer opts for project-specific tariff;
- municipal solid waste and refuse-derived-fuel-based projects with Rankine cycle technology;
- hybrid solar thermal power projects;
- other hybrid projects, including renewable or renewable-conventional sources, for which renewable technology is approved by the Ministry of New and Renewable Energy; and
- any other new renewable energy technologies approved by the Ministry of New and Renewable Energy.
Energy
Challenges
Some of the key opportunities for growth in the energy sector are the following:
- The industrial and commercial sectors present a significant opportunity for demand growth. Enhancing the contracting capacity of distribution companies could help utilize the existing thermal capacity surplus. Establishing power purchase agreements (PPAs) could alleviate financial distress and technical constraints, preventing load shedding and promoting demand and capacity offtake.
- Ensuring that state government utilities honor PPAs could boost investor confidence. Addressing concerns about higher tariffs of signed wind and solar power PPAs could alleviate the financial challenges of state distribution companies. Upholding the sanctity of contracts and ensuring timely dispute resolution could attract private sector participation and safeguard existing investments.
- Improving gas pipeline infrastructure could propel the growth of the industry. Addressing domestic production difficulties, pricing and allocation of gas, and enhancing infrastructure could also stimulate gas demand and consumption.
-
Water and Wastewater
-
Access to Water
93 %
-
Access to Sanitation
78 %
-
Number of PPPs Reaching FC
23
-
Value of PPPs Reaching FC
1,536 M
-
Number of PPPs with Foreign Sponsors
15
-
Number of PPPs with Govt. Support
14
FC = financial closure, Govt. = government, M = million.
Note: Access to water and sanitation as percentage of total population with access to improved water resources and sanitation facilities.
Sources: United Nations Children's Fund (UNICEF). Drinking Water, Sanitation and Hygiene (WASH) Estimates; and World Bank. Investment in Water and Sanitation with Private Participation (accessed 15 July 2023).
Water and Wastewater
Contracting Agencies
In the water sector, the Ministry of Jal Shakti, Department of Water Resources, River Development and Ganga Rejuvenation is responsible for laying down policy guidelines and programs for the development and regulation of the country’s water resources.
In the wastewater sector, under the Constitution of India, sanitation is a state government responsibility, and the delivery of related programs depends on urban local bodies (ULBs), which are backed by their respective state governments in terms of policy and fiscal support. The central government is mainly involved in delineating policies, providing funding for various programs of national importance such as the Jawaharlal Nehru National Urban Renewal Mission (JNNURM), and formulating national service level benchmarks.
The Ministry of Housing and Urban Affairs (MOHUA) has also conceived many schemes for supporting ULBs in improving water infrastructure and sewage treatment.
Water and Wastewater
Sector Laws and Regulations
The following are the laws and regulations that govern the water and wastewater sectors in India.1
Water
- The National Water Policy, 2012 serves as a policy guideline for developing and managing water resources in the country. The policy prioritizes water use in the following order: drinking, irrigation, hydropower, ecology, agricultural and nonagricultural industries, navigation, and other uses. These priorities may be modified or added if warranted by area- and region-specific considerations. The policy also encourages private participation in planning and operation of water systems.
- The Draft National Water Framework Bill, 2016 has been prepared and submitted to states and union territories to obtain their views and comments. The bill has been drafted to address the need for a national framework law as an umbrella statement of general principles governing legislative and/or executive powers by the central government, states, and local bodies.
- Comprehensive Mission Document for National Water Mission, Volume 1, 2011
- Comprehensive Mission Document for National Water Mission, Volume 2, 2008
- Hydro-Meteorological Data Dissemination Policy, 2018.
Wastewater
- The National Faecal Sludge and Septage Management Policy, 2017 aims to achieve 100% access to safe sanitation, integrated urban sanitation, and safe disposal of faecal waste. It sets environmental discharge norms and advocates a suitable, cost-effective, and phased strategy to meet these standards.
- The Water (Prevention and Control of Pollution) Act, 1974 and the subsequent Water (Prevention and Control of Pollution) Cess Act, 1977 were enacted to prevent water pollution caused by the discharge of untreated or inadequately treated domestic sewage in urban areas and untreated industrial effluents. The Central and State Pollution Control Boards, set up under these Acts, have been given the authority to regulate pollution of water bodies. The Boards are responsible for establishing standards for acceptable qualities of treated municipal sewage that can be discharged into water bodies, and monitoring and controlling pollution levels through various interventions.
- The Environment Protection Act, 1986 was formulated to cover various areas of the environment, including water pollution.
- At the state level, many states have promulgated municipal acts and other acts relating to the creation of separate boards or entities for providing water supply and sewerage services.
- 1Government of India; Ministry of Jal Shakti; Department of Water Resources, River Development and Ganga Rejuvenation. Policy/Schemes – Policies (accessed 15 July 2023).
Parameter 2021 2022 2023 Can the private sector be given water abstraction rights? Are there regulations in place on raw water extraction? Are there regulations in place on the release of treated effluents? - = Yes
The table below describes the functions of key agencies responsible for the water and wastewater sectors in India.
Key Entities
Agency Function (Indicative List) Ministry of Jal Shakti - In 2019, the former Ministry of Water Resources, River Development and Ganga Rejuvenation was reorganized into the Ministry of Jal Shakti. The Ministry works with two departments—(i) Department of Water Resources, River Development and Ganga Rejuvenation (Jal Sansadhan, Nadi Vikas Aur Ganga Sanrakshan Vibhag); and (ii) Department of Drinking Water and Sanitation (Peya Jal Aur Swachhata Vibhag). The Ministry is responsible for the development, conservation, and management of water as a national resource; overall national perspective of water planning and coordination in relation to the diverse uses of water and interlinking of rivers; overall policy issues; water resources, and major, medium, and minor irrigation works; and regulation and development of interstate rivers and water laws and legislation, among others.
Ministry of Drinking Water and Sanitation - Responsible for rural drinking water and related activities
Ministry of Housing and Urban Affairs (MOHUA) - Responsible for urban drinking water
- Responsible for formulating policies, such as the National Urban Sanitation Policy, and funding programs (e.g., Jawaharlal Nehru Urban Renewal Mission and Urban Infrastructure Development Scheme for Small and Medium Towns)
- MOHUA’s Central Public Health and Environmental Engineering Organisation formulates technical standards for the sewerage sector and approves detailed project reports for projects in the sewerage sector, which are provided with funding under various MOHUA schemes.
Ministry of Commerce and Industry - Responsible for industrial water and related policies and issues
Ministry of Power - Responsible for hydropower development and related policies and issues
Ministry of Ports, Shipping and Waterways - Responsible for inland navigation and related policies and issues
Ministry of Environment, Forest and Climate Change (MOEFCC) - The MOEFCC acts as the regulatory and monitoring body for environmentrelated outcomes and impacts of sewerage projects. The MOEFCC's Central Pollution Control Board, a national regulatory authority constituted under the Water (Prevention and Control of Pollution) Act of 1974, defines performance standards for the sewerage sector in terms of treated wastewater quality.
Ministry of Agriculture and Farmers Welfare - Responsible for water planning for agriculture, micro-irrigation, and management of water-related disaster such as drought
Ministry of Home Affairs - Manages water-related disasters such as floods
National Water Resource Council - Responsible for all policy decisions taken in the country
Central Ground Water Board - Conducts scientific studies; exploration aided by drilling; monitoring of groundwater regime; and assessment, augmentation, management, and regulation of the country’s groundwater sources.
National Water Development Agency - Carries out detailed studies (e.g., feasibility studies), surveys, and investigations with respect to peninsular components of the national perspective for water resources development
Central Pollution Control Board - Responsible for monitoring water quality
Municipal Corporations (Urban Local Bodies) - Locally, these corporations provide services like water supply, sanitation, health, drainage, and solid waste management.
Sources: Asian Development Bank. 2019. Public–Private Partnership Monitor. Second Edition; Government of India. Ministry of Jal Shakti. Department of Water Resources, River Development and Ganga Rejuvenation; and Government of India, Ministry of Jal Shakti, Department of Water Resources, River Development and Ganga Rejuvenation. 2011. Comprehensive Mission Document for National Water Mission. Volume 1.
Wastewater
The Ministry of Water Resources recently formulated a policy for public–private partnership (PPP) projects in the wastewater sector through an innovative hybrid annuity model (HAM) under the Namami Gange Programme. This approach seeks to ensure performance, efficiency, and sustainability of the proposed wastewater investments by using long-term PPP contracts, wherein the private sector will be responsible for technological innovation, construction, and operation and maintenance (O&M) of assets. Under the hybrid annuity program, up to 40% of the capital investment will be paid by the central government for milestones linked to construction progress, with the balance paid through annuities over the remaining life of the concession extending up to 20 years. The Government of India plans to establish a special purpose vehicle (SPV) to develop and structure projects, identify private sector partners, and create capacity to effectively monitor performance during the concession period. The SPV will enter into tripartite agreements with respective states and ULBs to support individual projects.2
PPPs in the sewerage sector are typically in the form of build–operate–transfer (BOT), end-user PPP, annuity, user charge, and design–build–operate. Of these, the most successful variants have been the BOT, end-user PPP, and the design–build–operate model.
At the national level, the Ministry of Jal Shakti, through the Department of Water Resources, River Development and Ganga Rejuvenation, has taken up a flagship program under the National Mission for Clean Ganga called the Namami Gange Programme. The Namami Gange Programme is an integrated conservation mission, approved as the flagship program by the Union Government in June 2014, with a budget outlay of ₹200 billion, to effectively abate pollution and conserve and rejuvenate the National River Ganga. Creating sewage treatment capacity is one of the key objectives of the program.
As of July 2023, 259 out of 442 sanctioned projects have been completed—a 58.6% project completion rate. A total of 132 projects are under progress, 42 are under tendering, and 12 have Administration Approval and Expenditure Sanction issued. About 45.1% of the sanctioned cost of ₹3,736 billion ($45.6 billion) has already been incurred.3
- 2Federation of Indian Chambers of Commerce and Industry, and 2030 Water Resources Group. 2016. Urban Wastewater Public–Private Partnerships. White Paper.
- 3Government of India, Ministry of Jal Shakti, National Mission for Clean Ganga. 2023. Monthly Project Progress Report. July.
Foreign Investment
COMPAREDOWNLOADParameter 2021 2022 2023 Maximum allowed foreign ownership of equity in greenfield projects Bulk water supply and treatment
100% 100% 100% Water distribution
100% 100% 100% Wastewater treatment
100% 100% 100% Wastewater collection
100% 100% 100% Standard Contracts
COMPAREDOWNLOADType of contract Availability PPP/concession agreement Bulk water supply agreement Performance-based operation and maintenance contract Engineering, procurement, and construction contract - Yes
Source: Asian Development Bank. 2019. Public–Private Partnership Monitor. Second Edition.
Water and Wastewater
Sector Master Plan
As explained earlier, water supply and wastewater planning, procurement, and execution are done at the level of ULBs, with approvals from respective state governments. For example, the state of Telangana in Southern India has conceived a program named Mission Bhagiratha, a massive project with an outlay of ₹450.28 billion ($5.5 billion).1 The program aims to
- ensure safe and sustainable piped drinking water supply from surface water sources at (i) 100 liters per capita per day (LPCD) for rural areas, (ii) 135 LPCD for municipalities, and (iii) 150 LPCD for municipal corporations, with 10% quantity allocated to industrial requirements; and
- provide each household with a tap connection.
The project scope includes the following:2
- 26 segments in 32 districts;
- the entire water supply chain;
- sourcing water from major rivers or reservoirs fed by these rivers;
- purifying the raw water in the nearby water treatment plant;
- pumping treated water to major overhead service reservoirs and sumps at the highest points;
- transmitting from the highest point through a secondary pipeline network to all habitations by gravity;
- providing tap connections to each household through a modern, rationalized intravillage network; and
- an estimated total pipeline network of 146,000 km.
The Mission Bhagiratha is under construction. It is funded by the government but is expected to involve private sector players in the O&M contracts. Similarly, the master plans will be prepared at various levels of local governments for provision of water supply and wastewater treatment.
In addition to specific initiatives being taken at the respective ULBs in each state, under the MOHUA, the Government of India has launched the Atal Mission for Rejuvenation and Urban Transformation (AMRUT).3 The Mission aims to provide basic civic amenities like water supply, sewerage, urban transport, and parks to improve the quality of life for all, especially for poor people and disadvantaged groups. It covers 500 cities, including all cities and towns with a population of more than 100,000 with notified municipalities. The total outlay for AMRUT is ₹500 billion for 5 years from FY2015–FY2016 to FY2019–FY2020. AMRUT was implemented as a central sponsored scheme, wherein the project fund is divided among states and union territories in an equitable formula—50:50 weightage is given to the urban population of each state or union territory and several statutory towns.
Universal coverage of water supply is a priority under the Mission. At the inception of AMRUT, the water supply coverage was 64%; the target is to cover all households by the end of the Mission. AMRUT also aims to provide 13.9 million water tap connections to achieve universal coverage against 2.29 million tap connections that have been provided so far. Against the total plan size of ₹776.40 billion ($9.47 billion), ₹390.11 billion ($4.76 billion or 50%) has been allocated to water supply. A substantial coverage of sewerage and septage management is the second top priority under the Mission. At the inception of AMRUT, sewerage coverage was 31% of households, which is aimed to be doubled to 62% by the end of the Mission.
Sewerage and septage sector projects include decentralized or networked underground sewerage systems, sewage treatment plants, rehabilitation of old sewerage system and treatment plants, and recycling and reuse of water for beneficial purposes. Projects related to fecal sludge management and mechanical and biological cleaning of sewers are also eligible for funding. Against the total plan size of ₹776.40 billion ($9.47 billion), ₹324.56 billion ($3.96 billion or 42%) has been allocated to sewerage and septage management.
Following this, the AMRUT 2.0 scheme was launched on 1 October 2021, to be implemented for a period of 5 years (i.e., from FY2021–FY2022 to FY2025–FY2026). The second phase is designed to provide universal coverage of water supply through functional taps to all households in all the statutory towns in the country and coverage of sewerage/septage management in 500 cities covered in the first phase of the AMRUT scheme. AMRUT 2.0 will promote circular economy of water through development of the City Water Balance Plan for each city, focusing on recycle and reuse of treated sewage, rejuvenation of water bodies, and water conservation.4
As of March 2023, 80% of projects under AMRUT 2.0 have been completed, with 40% of the total allocated project costs having been incurred. Additionally, as of March 2023, 13.7 million water tap connections (against the targeted 13.9 million) and 10.5 million sewer connections (against the targeted 14.5 million)—including households covered through Faecal Sludge and Septage Management—have been provided through AMRUT. A total sewage treatment capacity of 6,347 million liters per day (MLD) is being developed through the AMRUT projects, of which, 2,840 MLD sewage treatment capacity has been created and 1,437 MLD capacity has been developed for recycle and reuse. Against the central government’s share of ₹359.90 billion ($4.4 billion) for projects, ₹317.84 billion ($3.88 billion) has been released so far.5
Another scheme has been conceived under the Ministry of Jal Sakthi, called the Jal Jeevan Mission. It aims to establish functional household tap connections by 2024 to every rural household with a service level at the rate of 55 LPCD.6
- 1Mission Bhagiratha. (accessed 15 July 2023).
- 2Government of India; Ministry of Jal Shakti; Department of Water Resources, River Development and Ganga Rejuvenation. Namami Gange Programme.
- 3Government of India, Ministry of Housing and Urban Affairs. Atal Mission for Rejuvenation and Urban Transformation. (accessed 15 July 2023).
- 4Government of India, Ministry of Housing and Urban Affairs, Press Information Bureau. 2022. AMRUT Scheme. press release. 22 December.
- 5Government of India, Ministry of Housing and Urban Affairs, Press Information Bureau. 2023. Success of AMRUT. Press release. 20 March.
- 6Government of India, Ministry of Jal Shakti, Department of Drinking Water and Sanitation. Jal Jeevan Mission..
The table below shows the estimated investments in the water sector until 2025, based on the National Infrastructure Pipeline of the Government of India.
Capital Expenditure Plan for the Water Sector, Based on the National Infrastructure Pipeline
Project Category No. of Projects Capital Expenditure, FY2020–FY2025 ($ billion) (₹ billion) Water supply and sanitation, green parks, sewage treatment plant (AMRUT) 405 5.78 473.82 Water supply, rejuvenation of water bodies, wastewater collection and treatment (Jal Jeevan Mission) 0 34.09 2,794.92 AMRUT = Atal Mission for Rejuvenation and Urban Transformation, FY = fiscal year.
Source: Government of India, Ministry of Finance, Department of Economic Affairs. 2019. National Infrastructure Pipeline. Volume 2.
Projects Under Preparation and Procurement
Water and Wastewater Public-Private Partnerships under Preparation and Procurement
COMPAREDOWNLOADNotes:
1. The hyphen symbol (-) means data are not available.
2. Projects under conceptualization and development have been extracted from the India Investment Grid website. The website serves as a repository of a list of projects under the National Infrastructure Pipeline (NIP), which is constantly updated and provides attractive investment opportunities The website also features the non-NIP, which includes additional project opportunities collated by the India Infrastructure Grid.
Source: Government of India, Ministry of Commerce and Industry, Department for Promotion of Industry and Internal Trade, India Investment Grid. Projects under NIP and Non-NIP (accessed 15 July 2023).
Water and Wastewater
Features of Past PPP Projects
Procurement of PPP Projects
Water and Wastewater Public-Private Partnerships procured through various modes
COMPAREDOWNLOADPPP Projects Reaching Financial Close
Water and Wastewater Public-Private Partnerships reaching Financial Close
COMPAREDOWNLOADPPP = public–private partnership.
Note: Only active and concluded projects are considered in the graph
Source: World Bank. Infrastructure Finance, PPPs and Guarantees. Custom Query (accessed 3 January 2024).
Public–Private Partnership Projects with Foreign Sponsor Participation
Water and Wastewater Public-Private Partnerships with Foreign Sponsor Participation
COMPAREDOWNLOADPPP = public–private partnership
Notes: Only active and concluded projects are considered in the graph. Information on one project (1990–2022) is either partially available or not available and, hence, excluded.
Source: World Bank. Infrastructure Finance, PPPs and Guarantees. Custom Query (accessed 3 January 2024).
Government Support for Public–Private Partnership Projects
Government Support for Water and Wastewater Public-Private Partnerships
COMPAREDOWNLOADNote: Only active and concluded projects are considered in the graph.
Source: World Bank. Infrastructure Finance, PPPs and Guarantees. Custom Query (accessed 3 January 2024).
Payment Mechanisms for Public–Private Partnership Projects
Payment Mechanisms for Water and Wastewater Public-Private Partnerships
COMPAREDOWNLOADNotes: Only active and concluded projects are considered in the graph. Information on three projects (up to 2022) is not applicable, according to the database, and is therefore excluded.
Source: World Bank. Infrastructure Finance, PPPs and Guarantees. Custom Query (accessed 3 January 2024).
Past PPP projects in the water and wastewater sectors in terms of PPP variant or scheme, based on the Department of Economic Affairs (DEA) database, are shown in below table.
Number of Water and Wastewater Projects Across Public–Private Partnership Variants
Public–Private Partnership Variant No. of Projects Build–operate–transfer 10 Build–operate–transfer (annuity) 3 Build–own–operate 2 Build–own–operate–transfer 8 Design–build–finance–operate–transfer 7 Design–build–operate–transfer 2 Design–build–own–operate–transfer 3 Management contract (operation and maintenance) 3 Not available 10 Total 48 Note: Data was last updated on 5 December 2019.
Source: Government of India, Ministry of Finance, Department of Economic Affairs. List of All PPP Projects (accessed 15 July 2023).
Below table indicates the number of water and wastewater projects across various subsectors, based on the DEA database.
Number of Water and Wastewater Projects Based on Subsectors
Subsector No. of Projects Sewage collection, treatment, and disposal system 21 Water supply pipeline 20 Water treatment plants 7 Total 48 Note: Data was last updated on 5 December 2019.
Source: Government of India, Ministry of Finance, Department of Economic Affairs. List of All PPP Projects (accessed 15 July 2023).
Typical Risk Allocation for PPP Projects
COMPAREDOWNLOADRisk Type Private Public Shared Demand Revenue Collection Tariff Government Payment Environment and Social Land Acquisition Interface Handover Political Foreign Exchange (FOREX) - Yes
LEARN MOREWater and Wastewater
Features of Past PPP Projects
The risk allocation framework under various PPP variants is articulated in the tool kit on water and sanitation prepared by the DEA. Below table presents the risk allocation matrix based on the tool kit.
Typical Risk Allocation Matrix for Variants of Public–Private Partnership Projects
Type of Risk BOT (with fixed payment) BOT (with user charges) Concession (for brownfield assets) Performance Based Management Contracts Service Maintenance Contracts Pre-Operative Task Risks Delays in land acquisition Public sector Public sector Public sector Not relevant Not relevant External linkages Public sector Public sector Public sector Not relevant Not relevant Financing risks Private sector Private sector Private sector Not relevant Not relevant Planning Private sector Private sector Private sector Not relevant Not relevant Construction Phase Risks Design risk Private sector Private sector Private sector Not relevant Not relevant Construction risk Private sector Private sector Private sector Not relevant Not relevant Approvals Private sector Private sector Private sector Not relevant Not relevant Operations Phase Risks Operation and maintenance risk Private sector Private sector Private sector Private sector Private sector Volume risk Public sector Private sector Private sector Public sector Public sector Payment risk Public sector Private sector Private sector Public sector Public sector Financial risk Private sector Private sector Private sector Private sector Not relevant Performance risk Private sector Private sector Private sector Private sector Private sector Environmental risk Private sector Private sector Private sector Private sector Private sector Handover Risk Events Handover risk Private sector Private sector Private sector Private sector Not relevant Terminal value risk Private sector Private sector Private sector Private sector Not relevant Other Risks Change in law Public sector Public sector Public sector Public sector Public sector Force majeure Shared Shared Shared Shared Shared Concessionaire risk Public sector Public sector Public sector Public sector Public sector Sponsor risk Private sector Private sector Private sector Private sector Private sector Concessionaire’s event of default Private sector Private sector Private sector Private sector Private sector Government’s event of default Public sector Public sector Public sector Public sector Public sector BOT = build–operate–transfer
Sources: Asian Development Bank. 2019. Public–Private Partnership Monitor. Second Edition; and Government of India, Ministry of Finance, Department of Economic Affairs. 2010. PPP Toolkit for Improving PPP Decision-Making Processes.
Source: Asian Development Bank. 2019. Public–Private Partnership Monitor. Second Edition.
Financing Details
Parameter 1990-2020 1990-2021 1990-2022 PPP projects with foreign lending participation UA 1 1 PPP projects that received export credit agency/international financing institution support 1 2 2 Typical debt:equity ratio 45:55 45:55 45:55 Time for financial closure UA Typical concession period 15–20 years Typical Financial Internal Rate of Return UA Source: World Bank. Infrastructure Finance, PPPs and Guarantees. Custom Query (accessed 3 January 2024).
Water and Wastewater
Tariffs
The tariff for the water and wastewater sectors is a local government responsibility and is determined by the respective local government authorities, such as cities and municipalities.
Water tariffs and tariff grids in the two major cities of Hyderabad and Bengaluru are extracted from secondary sources.
Water Tariff for the Hyderabad Metropolitan Water Supply and Sewerage Board
Water Consumption per Month (rate/cubic meter) 15 cubic meters 50 cubic meters 100 cubic meters $ ₹ $ ₹ $ ₹ Tariff 0.53 43.40 0.23 18.83 0.37 30.30 - Fixed charge
0.53 43.40 0.16 13.10 0.08 6.55 - Variable charge
0.00 0.00 0.07 5.73 0.29 23.75 Tariff reference date: 1 December 2011 Source: International Benchmarking Network of the World Bank (IBNET) Tariff Database. Tariffs for Hyderabad Metropolitan Water Supply & Sewerage Board, HMWS&SB (India) (accessed 15 July 2023).
Tariff Grid for the Hyderabad Metropolitan Water Supply and Sewerage Board
Water Consumption (cubic meter per month) Tariff (rate/cubic meter) $ ₹ 1st Block 0 to 41.8 0.00 0.00 2nd Block 41.81 to 50 0.42 34.43 3rd Block 50.01 to 100 0.52 42.63 4th Block 100.01 to 200 0.67 54.93 5th Block 200.01 and more 0.77 63.12 Other charges 0.00 0.00 Fixed charges ($/month) 8.00 655.84 Source: International Benchmarking Network of the World Bank (IBNET) Tariff Database. Tariffs for Hyderabad Metropolitan Water Supply & Sewerage Board, HMWS&SB (India) (accessed 15 July 2023).
Tariff for Wastewater for the Hyderabad Metropolitan Water Supply and Sewerage Board
Water Consumption per Month (rate/cubic meter) 15 cubic meters 50 cubic meters 100 cubic meters $ ₹ $ ₹ $ ₹ Tariff 0.19 15.56 0.10 8.19 0.14 11.46 - Fixed charge
0.00 0.00 0.00 0.00 0.00 0.00 - Variable charge
0.19 15.56 0.10 8.19 0.14 11.46 - Other charges
0.00 0.00 0.00 0.00 0.00 0.00 - Value-added tax
0.00 0.00 0.00 0.00 0.00 0.00 Tariff reference date: 1 December 2011 Source: International Benchmarking Network of the World Bank (IBNET) Tariff Database. Tariffs for Hyderabad Metropolitan Water Supply & Sewerage Board, HMWS&SB (India) (accessed 15 July 2023).
Water Tariff for the Bangalore Water Supply and Sewerage Board
Water Consumption per Month (rate/cubic meter) 15 cubic meters 50 cubic meters 100 cubic meters $ ₹ $ ₹ $ ₹ Tariff 0.20 16.38 0.32 26.20 0.54 44.22 - Fixed charge
0.05 4.09 0.02 1.64 0.02 1.64 - Variable charge
0.08 6.55 0.27 22.11 0.50 40.95 - Other charges
0.06 4.91 0.02 1.64 0.01 0.82 - Value-added tax
0.00 0.00 0.00 0.00 0.00 0.00 Tariff reference date: 2 December 2014 Source: International Benchmarking Network of the World Bank (IBNET) Tariff Database. Tariffs for Bangalore Water Supply and Sewerage Board (India) (accessed 15 July 2023).
Tariff Grid for the Bangalore Water Supply and Sewerage Board
Water Consumption (cubic meter per month) Price after October 2013 (rate/cubic meter) ₹ $ 1st Block 0 to 8 0.00 0.00 2nd Block 8.01 to 25 0.18 14.74 3rd Block 25.01 to 50 0.42 34.39 4th Block 50.01 and more 0.73 59.78 Other charges 0.00 0.00 Other fixed charges ($/month) 0.91 74.52 Fixed charge 1st block ($/cubic meter) 0.49 40.13 Fixed charge 2nd block ($/cubic meter) 0.82 67.15 Fixed charge 3rd block ($/cubic meter) 1.22 99.91 Fixed charge 4th block ($/cubic meter) 2.45 200.63 Source: International Benchmarking Network of the World Bank (IBNET) Tariff Database. Tariffs for Bangalore Water Supply and Sewerage Board (India) (accessed 15 July 2023).
Tariff for Wastewater for the Bangalore Water Supply and Sewerage Board
Water Consumption per Month (rate/cubic meter) 15 cubic meters 50 cubic meters 100 cubic meters $ ₹ $ ₹ $ ₹ Tariff 0.04 3.28 0.07 5.73 0.13 10.65 - Fixed charge
0.02 1.64 0.00 0.00 0.00 0.00 - Variable charge
0.02 1.64 0.07 5.73 0.13 10.65 - Other charges
0.00 0.00 0.00 0.00 0.00 0.00 - Value-added tax
0.00 0.00 0.00 0.00 0.00 0.00 Tariff reference date: 2 November 2014 Source: International Benchmarking Network of the World Bank (IBNET) Tariff Database. Tariffs for Bangalore Water Supply and Sewerage Board (India) (accessed 15 July 2023).
Tariff Grid for Wastewater for the Bangalore Water Supply and Sewerage Board
Water Consumption (cubic meter per month) Price after October 2013 (rate/cubic meter) ₹ $ 1st Block 0 to 8 0.00 0.00 2nd Block 8.01 to 25 0.04 3.28 3rd Block 25.01 to 50 0.11 9.01 4th Block 50.01 and more 0.18 14.74 Other charges 0.00 0.00 Fixed charges ($/month) 0.23 18.83 Source: International Benchmarking Network of the World Bank (IBNET) Tariff Database. Tariffs for Bangalore Water Supply and Sewerage Board (India) (accessed 15 July 2023).
Water and Wastewater
Challenges
- Enhancing the institutional capacity of urban local bodies (ULBs) can lead to better planning, preparation, and execution of PPPs. This includes improving governance and project management, which can increase the number and quality of PPPs undertaken. Additionally, increasing budget allocations for ULBs can help manage project preparatory expenses and fulfill annuity obligations.
- Establishing robust guarantee frameworks can protect the private sector in the event of default by ULBs. This can increase the interest of the private sector in PPP projects. Addressing politically sensitive issues such as tariff revisions can ensure appropriate tariffs for cost recovery, enhancing the sustainability of PPP projects.
- Improving the accuracy of data on connections, infrastructure, and metering can make it easier for private players to enter into contracts with ULBs.
- Enhancing the creditworthiness of ULBs can boost private sector confidence in the ULBs’ ability to fulfill their obligations.
The centrally sponsored programs, such as Atal Mission for Rejuvenation and Urban Transformation (AMRUT), AMRUT 2.0, Jal Jeevan Mission, Namami Gange Programme, and the Jawaharlal Nehru National Urban Renewal Mission (JNNURM), have been leading to substantial reforms in the way ULBs function. Also, there is a gradual acceptability from the public at all levels of private sector involvement in infrastructure development.
-
ICT

-
Telephone Subscribers
1.62
-
Cellular Phone Subscribers
81.99
-
Cellular Network Coverage
93.5 %
-
Internet Subscribers
1.96
-
Internet Bandwidth per User
5.68 kbps
-
Number of PPPs Reaching FC
25
-
Value of PPPs Reaching FC
3,272 M
-
Number of PPPs with Foreign Sponsors
11
-
Number of PPPs with Govt. Support
8
FC = financial closure, ICT = information and communication technology, kbps = kilobits per second.
Note: Telephone, cellular phone, and internet subscribers per 100 inhabitants. Cellular network coverage as percentage of population covered.
Sources: The Global Economy. Internet Bandwidth - Country Rankings (accessed 15 July 2023); The Global Economy. Internet Subscribers, per 100 people - Country Rankings (accessed 15 July 2023); The Global Economy. Mobile Network Coverage - Country Rankings (accessed 15 July 2023); The Global Economy. Mobile Phone Subscribers, per 100 people - Country Rankings (accessed 15 July 2023); and World Bank. Fixed Telephone Subscriptions (per 100 people) (accessed 15 July 2023).
The information and communication technology (ICT) industry in India comprises
- information technology (IT), consisting of software, IT services, and IT-enabled services and/or business process outsourcing, and contributing to around 7.9% of the country’s GDP; and
- telecom industry, consisting of wireless, wireline, and other telecommunication services such as internet, broadband, and satellite, and contributing to around 6.5% of the country’s GDP.
ICT
Contracting Agencies
Key Agencies
- The Department of Telecommunications, under the Ministry of Communications, is responsible for formulating development policies, granting licenses for various telecom services, and enforcing wireless regulatory measures.
- The Ministry of Electronics and Information Technology is the competent authority to enter into contracts for IT sector projects.
- The Telecom Regulatory Authority of India (TRAI) was established in 1997 through an Act of Parliament to regulate telecom services and fix or revise tariffs for telecom services, which used to be the responsibility of the central government. The TRAI Act was amended by an ordinance in January 2000 to establish the Telecommunications Dispute Settlement and Appellate Tribunal, which was intended to take over the adjudicatory and disputes functions from the TRAI. The Telecommunications Dispute Settlement and Appellate Tribunal was set up to adjudicate any dispute between a licensor and a licensee, between two or more service providers, and between a service provider and a group of consumers, and to hear and dispose appeals against any direction, decision, or order of the TRAI. The TRAI is responsible for the regular review and issuance of tariff orders for telecom and broadcasting services in the country, in addition to licensing, regulation of activities, and consumer protection, among others.
Information and Communication Technology Players
The major IT players in India are Tata Consultancy Services (generates roughly 70% of the revenue for Tata Sons, and is one of the global leaders in the IT sector), Infosys, HCL Technologies Limited, Wipro, Tech Mahindra, and Mindtree. The major telecom players in the country are Reliance Jio, Bharti Airtel, Vodafone Idea, and Bharat Sanchar Nigam Limited.
ICT
Sector Laws and Regulations
The key policies and acts under the Ministry of Electronics and Information Technology are listed below:1
- Information Technology Act, 2000;
- National Policy on Software Products, 2019;
- National Policy on Electronics, 2019;
- National Cyber Security Policy, 2013;
- Internet of Things Policy, 2016; and
- Right to Information Act.
The key policies and acts under the Ministry of Communications include the following:2
- National Telecom Policy, 2012;
- Broadband Policy, 2004;
- Amendment to Broadband Policy, 2004;
- National Digital Communications Policy, 2018;
- Indian Telegraph Act; and
- National Broadband Mission, 2019.
- 1Government of India, Ministry of Electronics and Information Technology. Acts and Rules, Policies and Guidelines. (accessed 15 July 2023).
- 2Government of India. Department of Telecommunications.
Foreign Investment Restrictions
COMPAREDOWNLOADParameter 2021 2022 2023 Maximum allowed foreign ownership of equity in greenfield projects Fixed line infrastructure
100% 100% 100% Fixed line services
100% 100% 100% Wireless/mobile infrastructure
100% 100% 100% Wireless/mobile services
100% 100% 100% LEARN MOREICT
Sector Laws and Regulations
For the telecom sector, a foreign direct investment (FDI) of up to 49% is allowed under an automatic route. An FDI beyond 49% will go through the approval of the Department of Telecommunication and Foreign Investment Promotion Board.1
- 1Government of India, Department of Telecommunications. FDI Policy in Telecom..
Standard Contracts and Licenses
COMPAREDOWNLOADType of contract Availability PPP/concession agreement Performance-based operation and maintenance contract Engineering, procurement, and construction contract License agreement - Yes
- Unavailable
ICT
Sector Master Plan
The Ministry of Communications, through key documents including the National Broadband Mission and National Digital Communications Policy of 2018, articulates the sector’s goals and objectives to be achieved by 2022. Some of these key goals are the following:
- Provide universal broadband connectivity at 50 megabits per second (Mbps) to every citizen.
- Provide all villages in India access to broadband under the BharatNet project. In August 2020, the Government of India announced extending broadband to all villages in India over a 1,000-day period. The Bharat Broadband Network Limited has implemented the BharatNet project, which aims to connect 250,000 gram panchayats (village councils) in India via a broadband using an optimal mix of underground fiber, fiber over power lines, and radio and satellite media network, and to provide 100 Mbps of speed to all gram panchayats. The project totaled ₹171.45 billion ($2.35 billion) and was expected to be completed by FY2022. A capital expenditure of ₹130 billion ($1.78 billion) was expected to be incurred over FY2020–FY2022 for this project. It was also expected to provide 1 gigabit per second connectivity to all Gram panchayats of India by 2020 and 10 gigabits per second by 2022. To fast track the project implementation, the government, in June 2021, decided to revise the implementation strategy of BharatNet by adopting a public–private partnership (PPP) mode in 16 states of the country. The revised strategy also includes creation, upgrading, O&M, and utilization of BharatNet by the concessionaire who will be selected through a competitive international bidding process, with an estimated maximum viability gap funding of up to ₹190.4 billion approved. About 361,000 villages including the gram panchayats will be covered. The PPP model will leverage private sector efficiency for operation, maintenance, utilization, and revenue generation, and is expected to result in faster rollout of BharatNet. The selected concessionaire (private sector partner) is expected to provide reliable, high-speed broadband services based on a predefined Services Level Agreement.1 As of August 2023, 194,000 villages have received connectivity under the project.2
- Accelerate fiberization by increasing the route length of the optical fiber cable from the current 2.2 million km to 5.0 million km.
- Enable 100 Mbps broadband on demand to all key development institutions, including all educational institutions.
- Enable fixed line broadband access to 50% of households.
- Achieve a unique mobile subscriber density of 55 by 2020 and 65 by 2022.
- Enable deployment of public Wi-Fi hotspots to reach 5 million by 2020 and 10 million by 2022.
- Ensure connectivity to all uncovered areas.
- Attract investments of $100 billion in the digital communications sector.
- Train 1 million personnel on “new age skills.”
- Expand Internet of Things ecosystem to 5 billion connected devices.
- Increase tower density from the current 0.42 towers per thousand population to 1.0 per thousand population by setting up an additional 1 million towers.
- Facilitate the rollout of 5G network and strengthen the 4G network.
- Increase by around two and a half times the number of fiberized telecom towers in the country.
- Make available government services in real time via mobile technology.
- Improve India’s ranking in the ICT Development Index of the International Telecommunications Union from 134 in 2017 into the top 25 nations.3
In terms of India’s progress in attaining the goals set by the ICT Master Plan by 2022, the results are mixed.
- About 52% of India’s population had internet access in 2022 against the target of 100%.4
- Broadband connectivity reached 93% of villages in 2022 against the target of 100%.5
- To add to the ICT master plan, the Prime Minister launched 5G services on 1 October 2022 for India to attain 350 million 5G subscriptions by 2026, accounting for 27% of all mobile subscriptions.
- Additionally, the Union Cabinet approved a $1.65 billion production-linked incentive scheme for telecom and networking products under the Department of Telecom.
- On December 2022, 42 companies committed an investment of $502.95 million, comprising 28 micro, small, and medium-sized enterprises (MSMEs) and 14 non-MSMEs.
- To drive the development of 6G technology, the Department of Telecom has developed a 6G innovation group.6
- In the IT sector, the government introduced the Software Technology Parks Scheme, which is a 100% export-oriented scheme for the development and export of computer software, including the export of professional services.7
Data centers have been listed in the Harmonized Master List of Infrastructure Sub-sectors in October 2022, thereby making it easier for banks to finance this sub-sector and broaden the scope of private participation.
- 1Government of India, Press Information Bureau. 2021. Cabinet Approves BharatNet Implementation through Public Private Partnership Model in 16 States with Optical Fibre Connectivity to All Inhabited Villages. Press release. 30 June.
- 2S. R. Singh. 2023. Cabinet Approves ₹1.39 trillion for BharatNet Project. The Hindu Business Line. 5 August.
- 3Government of India, Ministry of Communications, Department of Telecommunications. 2019. National Broadband Mission;and Government of India, Department of Telecommunications. 2018. National Digital Communications Policy, 2018.
- 4R. Majumdar. 2023. 52% of Indian Population Had Internet Access in 2022, Says Report. The Economic Times. 3 May.
- 5T. S. Thakur. 2022. Broadband Connectivity Reaches 93.21% Villages of India. TelecomTalk. 11 July.
- 6India Brand Equity Foundation (IBEF). Telecom Industry in India.
- 7IBEF. IT and BPM Industry in India.
The estimated capital expenditure planned for the sector, based on the National Infrastructure Pipeline, is summarized in below table.
Capital Expenditure Plan
Project Category No. of Projects Capital Expenditure, FY2020–FY2025 ($ billion) (₹ billion) 4G project of BSNL and MTNL 2 4.55 372.84 Network for spectrum 1 1.8 147.68 BharatNet 1 1.59 130.00 Private player capex 2 27.81 2,280.00 Others 8 1.42 116.40 Total 14 37.17 3,046.92 BSNL = Bharat Sanchar Nigam Limited, FY = fiscal year, MTNL = Mahanagar Telephone Nigam Limited.
Source: Government of India, Ministry of Finance, Department of Economic Affairs. 2019. National Infrastructure Pipeline. Volume 2.
Projects under Preparation and Procurement
ICT Public-Private Partnerships under Preparation and Procurement
COMPAREDOWNLOADNotes:
1. The hyphen symbol (-) means data are not available.
2. Projects under conceptualization and development have been extracted from the India Investment Grid website. The website serves as a repository of a list of projects under the National Infrastructure Pipeline (NIP), which is constantly updated and provides attractive investment opportunities. The website also features the non-NIP, which includes additional project opportunities collated by the India Infrastructure Grid.
Source: Government of India, Ministry of Commerce and Industry, Department for Promotion of Industry and Internal Trade, India Investment Grid. Projects under NIP and Non-NIP (accessed 15 July 2023).
ICT
Features of Past PPP Projects
Procurement of PPP Projects
ICT Public-Private Partnerships procured through various modes
COMPAREDOWNLOADNotes: Only active and concluded projects are considered in the graph. The hyphen symbol (-) means there are no projects in the sector, data are unavailable or not applicable, according to the database. Information on 24 projects (up to 2020) is either not available or not applicable, according to the database, and is therefore excluded.
Source: World Bank. Infrastructure Finance, PPPs and Guarantees. Custom Query (accessed 3 January 2024).
PPP Projects Reaching Financial Close
ICT Public-Private Partnerships reaching Financial Close
COMPAREDOWNLOADPPP = public–private partnership
Note: Only active and concluded projects are considered in the graph.
Source: World Bank. Infrastructure Finance, PPPs and Guarantees. Custom Query (accessed 3 January 2024).
PPP Projects with Foreign Sponsor Participation
ICT Public-Private Partnerships with Foreign Sponsor Participation
COMPAREDOWNLOADPPP = public–private partnership
Notes: Only active and concluded projects are considered in the graph. Information on one project (1990–2022) is either partially available or not available and, hence, excluded.
Source: World Bank. Infrastructure Finance, PPPs and Guarantees. Custom Query (accessed 3 January 2024).
Payment Mechanism for PPP Projects
Payment Mechanisms for ICT Public-Private Partnerships
COMPAREDOWNLOADNotes: Only active and concluded projects are considered in the graph. The hyphen symbol (-) means there are no projects in the sector, data are unavailable or not applicable, according to the database. Information on 17 projects (up to 2022) is not applicable, according to the database, and is therefore excluded.
Source: World Bank. Infrastructure Finance, PPPs and Guarantees. Custom Query (accessed 3 January 2024).
Past PPP projects in the ICT sector, based on the Department of Economic Affairs (DEA) database, are shown in below table.
Number of Information and Communication Technology Projects
Subsector No. of Projects Telecommunication network and services 60 Total 60 Note: Data was last updated on 5 December 2019.
Source: Government of India, Ministry of Finance, Department of Economic Affairs. List of all PPP Projects (accessed 15 July 2023).
Typical Risk Allocation for PPP Projects
COMPAREDOWNLOADType of Risk Private Public Shared Comments Political In relation to discriminatory changes in law and expropriating actions, the risk is allocated to the nodal agency. In relation to general changes in law, the risk is allocated to the private party. Pre-Go Live risks Latent defect risk If the private party (or any of its subcontractors) designs and constructs the facilities, the risk is allocated to the private party; otherwise, the risk is allocated to the nodal agency Completion risk Design risk Cost overrun risk Shared depending on the nature of the cost overrun. In case the cost overrun is due to the private party, then the risk is allocated to the private party. Planning risk In relation to any nondesign and construction of the solution, the risk is allocated to the nodal agency. In relation to any design, the risk is allocated to the private party. Availability risk Market, demand, or volume risk In case the demand varies within a particular band, the risk is allocated to the private sector; for anything else, the risk is shared. Utilities supply risk This risk is allocated to the private party, unless the utilities are supplied by the nodal agency and such supplies are not covered by a special insurance. Insolvency and outside creditor risk Subcontractor risk Operating risk (technology, environment, cost, and management) Maintenance risk Force majeure risk If risks are insurable, risk is allocated to the private party. If risks are not insurable, then risk is shared as the nodal agency may pay some compensation. Regulatory risk Tax rate change risk Inflation risk Residual value risk - Yes
Source: Asian Development Bank. 2019. Public–Private Partnership Monitor. Second Edition.
Financing Details
Parameter 1990-2020 1990-2021 1990-2022 PPP projects with foreign lending participation UA UA UA PPP projects that received export credit agency/international financing institution support 3 3 3 Typical debt:equity ratio UA UA UA Time for financial closure UA Typical concession period 10 years Typical Financial Internal Rate of Return UA Source: World Bank. Infrastructure Finance, PPPs and Guarantees. Custom Query (accessed 3 January 2024).
ICT
Tariffs
The Telecom Regulatory Authority of India (TRAI) has been mandated to regulate tariff for the telecommunication sector in India under the TRAI Act. The TRAI initiated tariff regulation for telecommunication services in India with the notification of the Telecommunication Tariff Order (TTO), 1999. The TTO has been amended from time to time considering the changes in the sector landscape. The TTO provided for three types of tariffs at a broader level: (i) tariffs specified in the TTO, (ii) tariffs subjected to tariff ceiling specified in the TTO, and (iii) tariffs under forbearance.
The TRAI has expanded the scope of forbearance regime over the years and has given service providers the freedom to design the tariffs suited to the prevailing market conditions. However, the forbearance is subject to reporting requirements and adherence to specified principles of tariff assessments (i.e., transparency, nondiscrimination, and nonpredation). Over the years, the TRAI has moved from the “fixation of tariff rates” stage to the “forbearance with prior approval” stage, and finally to a stage of “forbearance regime with post-facto reporting obligation” with regulatory oversight. Accordingly, at present, except for a small list of regulated tariff products, tariffs for all other telecommunication services are under forbearance.1This freedom has led to the emergence of a multiple number of tariff plans and offers by telecom service providers both in the prepaid and postpaid segments.
- 1Government of India, Telecom Regulatory Authority of India. 2021. Consultation Paper on Validity Period of Tariff Offers. 13 May.
ICT
Challenges
Opportunities for growth in the ICT sector include the following:
- Broadband connectivity. Investments in infrastructure need to be enhanced and universal last-mile broadband connectivity needs to be promoted. Regardless of the trunk infrastructure, the quality and speed of service provisioning is highly dependent upon the last-mile connectivity infrastructure.
- Coordination among stakeholders and agencies. Creation of the digital communications infrastructure requires coordination and alignment of work among multiple stakeholders and agencies—central ministries and departments, state governments, local and municipal authorities, industries, and user communities—to achieve the intended objectives.
- Implementation of Indian Telegraph Right-of-Way Rules, 2016. Addressing the complexities and uncertainties of right-of-way policies across the country can reduce the cost of fiber rollouts, making it more affordable and accessible.
- Debt stress in the telecom services sector. The presence of hyper-competitive pricing in the industry, while challenging, also presents an opportunity for innovative financial strategies to alleviate debt stress and reduce nonperforming assets in the sector.
-
Social Infrastructure
Contracting Agencies
Healthcare Services
The Ministry of Health and Family Welfare is the contracting agency for the healthcare sector. The regulatory role of the ministry includes regulation of clinical establishments, professional and technical education, food safety, medical technologies, medical products, clinical trials, research, and implementation of health-related laws.1
At the local level, the Department of Health and Family Welfare acts as the contracting agency for public–private partnership (PPP) projects in the healthcare sector.
Education Services
At the central level, the Ministry of Human Resource Development is the government contracting agency for PPP projects in the education sector.
At the local level, the Department of School Education and Literacy and the Department of Higher Education of various state governments also act as the contracting agency.
Public Housing
The Ministry of Housing and Urban Affairs is the contracting agency for public housing projects.
Government Buildings
The Ministry of Housing and Urban Affairs is the contracting agency for government building projects.
- 1Government of India, Ministry of Health and Family Welfare. 2017. National Health Policy, 2017
Social Infrastructure
Sector Laws and Regulations
Healthcare Sector Regulations
The National Health Policy, 2017 is the pertinent policy for the healthcare sector.
Education Sector Regulations
The National Education Policy, 2020 is the policy for the education sector.
The Right to Education Act, 2009 is the overarching act for the education sector.
Public Housing Regulations
The key regulations for housing and development are articulated in the National Urban Housing and Habitat Policy of 2007.1 The following are the major objectives of the policy:
- facilitating accessibility to serviced land and housing for economically weaker sections and lower income groups;
- encouraging land assembly, development, and disposal by both private and public sectors;
- forging strong partnerships between public, private, and cooperative sectors;
- creating adequate housing stock, both on rental and ownership basis; and
- using technology to modernize and enhance energy and cost efficiency, productivity, and quality.
Government Building Regulations
No centrally available data.
Other Social Infrastructure Regulation—Prisons and Correction Centers
No centrally available data.
- 1Government of India, Ministry of Housing and Urban Poverty Alleviation. 2007. National Urban Housing and Habitat Policy, 2007.
Foreign Investment Restrictions
COMPAREDOWNLOADParameter 2021 2022 2023 Maximum allowed foreign ownership of equity in greenfield projectsa Construction of healthcare facilities
100% 100% 100% Services, including hospital management, specialist hospital/clinic, mental hospital, dental clinic, and laboratory and medical check-up services
100% 100% 100% Private maternity hospital, clinic general medical services/public hospital/ public medical clinic, residential health services, and basic healthcare services facility
100% 100% 100% Construction of education facilitiesb
100% 100% 100% Non formal education services (vocational training, computer education, and language education)
100% 100% 100% Formal education services
100% 100% 100% Government buildings
100% 100% 100% Prisons and correction centres
Public housing
100% 100% 100% - aInvest India. National Investment Promotion and Facilitation Agency. FDI Policy of India (accessed 15 July 2023).
- bConstruction and development projects (i.e., development of townships, construction of residential and commercial premises, roads or bridges, hotels, resorts, hospitals, educational institutions, recreational facilities, city and regional level infrastructure, townships).
- Not Applicable
Standard Contracts
Healthcare
Parameter Availability What standardized contracts are available and used in the market? - Public–private partnership/concession agreement?a
- Performance-based operation and maintenance contract?
- Engineering, procurement, and construction contract
- aGovernment of India, NITI Aayog. Model Agreements.
- Yes
- No
Education Services
Parameter Availability What standardized contracts are available and used in the market? - Public–private partnership/concession agreement?a
- Performance-based operation and maintenance contract?
- Engineering, procurement, and construction contract
- aGovernment of India, NITI Aayog. Framework of Model Concession Agreements.
- Yes
- No
Public Housing
Parameter Availability What standardized contracts are available and used in the market? - Public–private partnership/concession agreement?
- Performance-based operation and maintenance contract?
- Engineering, procurement, and construction contract
- No
Government Buildings
Parameter Availability What standardized contracts are available and used in the market? - Public–private partnership/concession agreement?
- Performance-based operation and maintenance contract?
- Engineering, procurement, and construction contract
- No
Social Infrastructure
Sector Master Plan
Healthcare
India’s Ministry of Health and Family Welfare introduced the National Health Policy in 2017 to progressively achieve universal health coverage, reinforce trust in the public healthcare system, and align the growth of the private healthcare sector with public health goals.
The policy also highlights quantitative objectives. The indicative, quantitative goals and objectives are outlined under three broad components: (i) health status and program impact, (ii) health systems performance, and (iii) health system strengthening. Some of the specific quantitative goals and objectives of the National Health Policy, 2017 are to
- increase life expectancy at birth from 67.5 years to 70 years by 2025 (in progress);
- reduce infant mortality rate to 28 by 2019 (achieved in 2020);
- increase utilization of public health facilities by 50% from current levels by 2025 (in progress);
- meet the need of family planning above 90% at national and subnational levels by 2025 (in progress);
- provide access to safe water and sanitation to all by 2020 (Swachh Bharat Mission) (in progress, India was declared open defecation free in 2019);
- increase the government’s health expenditure as a percentage of GDP from the existing 1.15% to 2.50% by 2025 (in progress);
- increase states’ healthcare sector spending to more than 8% of their budget by 2020 (in progress);
- establish primary and secondary care facility according to the norms in high-priority districts (selected based on population and time to reach norms) by 2025 (in progress);
- ensure district-level electronic database of information on health system components by 2020;
- strengthen the health surveillance system and establish registries for diseases of public health importance by 2020; and
- establish federated integrated health information architecture, health information exchanges, and national health information network by 2025 (in progress).
The policy proposed a potentially achievable target of raising public health expenditure to 2.5% of the GDP in a time-bound manner. The policy has a holistic coverage to ensure universal coverage and improve healthcare infrastructure and services, including those in rural and urban areas. Programs have been conceived to improve child and adolescent health and address malnutrition and micronutrient deficiencies through various initiatives, such as universal immunization and control of communicable diseases. The policy also articulates the need for mainstreaming the potential of Ayurveda, Yoga, Naturopathy, Unani, Siddha, Sowa-Rigpa, and Homoeopathy in providing holistic healthcare. The policy discusses human resources at various levels of medical education.
Education
The new National Education Policy was approved in July 2020, replacing the National Policy on Education of 1986.1 The new policy aims to bring transformational reforms in school and in higher education, such as modification of the curricular structure and improvement of enrollment ratios. Some of the key objectives of the policy are as follows:
- An autonomous body, the National Educational Technology Forum, will be created to provide a platform for the free exchange of ideas on the use of technology to enhance learning, assessment, planning, and administration.
- The National Education Policy, 2020 emphasizes setting up of a Gender Inclusion Fund and Special Education Zones for disadvantaged regions and groups.
- Central and state governments will work together to increase public investment in the education sector to reach 6% of GDP.
School Education
- The new National Education Policy aims to universalize education from preschool to secondary level, targeting 100% gross enrollment ratio in school education by 2030.
- The current 10+2 system will be replaced by a new 5+3+3+4 curricular structure corresponding to ages 3 to 8, 8 to 11, 11 to 14, and 14 to 18, respectively.
- A new and comprehensive framework, the National Curriculum Framework for Teacher Education 2021, was formulated by the National Council for Technical Education in consultation with the National Council of Educational Research and Training. The overarching objective of this National Curriculum Framework is to transform the school education system of India as envisioned in the National Education Policy 2020 through corresponding positive changes in the curriculum, including pedagogy. By 2030, the minimum degree qualification for teaching will be an integrated 4-year degree on Bachelor of Education.
Higher Education
- Gross enrollment ratio in higher education will be raised to 50% by 2035; a total of 35 million seats will be added in higher education.
- Models of exemplary multidisciplinary education at a global standard will be established in the country, comparable to the Indian Institute of Technology and the Indian Institute of Management. The National Research Foundation will be created as an apex body for fostering a strong research culture and building research capacity in higher education.
- The Higher Education Commission of India will be set up as a single overarching umbrella body for the entire higher education, excluding medical and legal education. The Higher Education Commission of India will have four independent verticals: (i) National Higher Education Regulatory Council for regulation, (ii) General Education Council for standard setting, (iii) Higher Education Grants Council for funding, and (iv) National Accreditation Council for accreditation. Public and private higher education institutions will be governed by the same set of norms for regulation, accreditation, and academic standards.
Public Housing
The Pradhan Mantri Awas Yojana – Urban Mission was launched as a centrally sponsored scheme in 2015. It seeks to meet the gap in urban housing units by 2022 through increased private sector participation and active involvement of the states. The Mission initially covered 500 Class I cities and was to be implemented in three phases between 2015 and 2022.2 It has four broad components or verticals, out of which a credit-linked subsidy will be implemented as a central sector scheme:
- slum rehabilitation of slum dwellers with participation of private developers using land as a resource;
- promotion of affordable housing for weaker sections through credit-linked subsidy—to encompass all 4,041 statutory census towns from the outset;
- affordable housing in partnership with public and private sectors—central assistance of ₹150,000 per house for economically weaker sections will be provided; and
- subsidy for beneficiary-led individual house construction or enhancement—central assistance of ₹150,000 per house for economically weaker sections will be provided.
Under the Pradhan Mantri Awas Yojana – Urban Mission, as of August 2023, 7.66 million houses have been completed, and a financial outlay of ₹1,424.94 billion has been incurred.3
In 2017, the Ministry of Housing and Urban Affairs (MOHUA) released the report on Public–Private Partnership Models for Affordable Housing. The report comprehensively describes the basic strategies for PPPs in affordable housing, implementation models along with the associated risk allocation frameworks, and the incentives and schemes available.4
- 1Government of India, Ministry of Human Resource Development. 2020. National Education Policy, 2020.
- 2Jones Lang LaSalle. 2016. Affordable Housing in India: Key Initiatives for Inclusive Housing for All.
- 3Government of India, Ministry of Housing Affairs. 2023. PMAY-U PMAY-U E-Newsletter. Issue No. 79. 31 August.
- 4Government of India, Ministry of Housing and Urban Affairs. 2017. Public–Private Partnership Models for Affordable Housing.
The table below shows the expected investments in the social infrastructure sector, according to estimates based on the National Infrastructure Pipeline, 2019.
Year-on-Year Capital Expenditure Plan for the Social Infrastructure Sector, Based on the National Infrastructure Pipeline
Social Infrastructure FY2020 FY2021 FY2022 FY2023 FY2024 FY2025 Total Higher Education ₹ billion 52.87 54.99 119.53 130.43 128.48 - 486.30 $ billion 0.64 0.67 1.46 1.59 1.57 - 5.93 School Education ₹ billion 50.53 71.32 70.77 63.98 65.69 55.62 377.91 $ billion 0.62 0.87 0.86 0.78 0.80 0.68 4.61 Health and Family Welfare ₹ billion 287.19 401.32 399.14 160.96 97.56 65.44 1,411.61 $ billion 3.50 4.90 4.87 1.96 1.19 0.80 17.21 Sports ₹ billion 13.2 15.47 14.24 13.89 12.2 8.4 77.40 $ billion 0.16 0.19 0.17 0.17 0.15 0.10 0.94 Tourism ₹ billion 11.04 15.81 20.59 18.63 11.96 7.15 85.18 $ billion 0.13 0.19 0.25 0.23 0.15 0.09 1.03 Total ₹ billion 414.83 558.91 389.85 387.89 315.89 136.61 2,203.98 $ billion 5.06 6.82 4.76 4.73 3.85 1.67 26.88 - = data unavailable, FY = fiscal year.
Note: Numbers may not sum precisely because of rounding.
Source: Government of India, Ministry of Finance, Department of Economic Affairs. 2019. National Infrastructure Pipeline. Volume 2.
Projects under Preparation and Procurement
Social Infrastructure Public-Private Partnerships under Preparation and Procurement
COMPAREDOWNLOADNotes:
1. The hyphen symbol (-) means data are not available.
2. Projects under preparation and procurement have been extracted from the India Investment Grid website. The website serves as a repository of a list of projects under the National Infrastructure Pipeline (NIP), which is constantly updated and provides attractive investment opportunities. The website also features the non-NIP, which includes additional project opportunities collated by the India Infrastructure Grid.
Source: Government of India, Ministry of Commerce and Industry, Department for Promotion of Industry and Internal Trade, India Investment Grid. Projects under NIP and Non-NIP (accessed 15 July 2023).
Social Infrastructure
Features of Past PPP Projects
The PPP Monitor defines social infrastructure sector as covering healthcare, education, public housing, and government building infrastructure. This definition has been adopted across all countries for consistency. The World Bank Private Participation in Infrastructure (PPI) database does not comprehensively cover all projects and/or subsectors in the social sector category. To showcase a more comprehensive list, projects from the Department of Economic Affairs (DEA) database have been considered.
The DEA's classification of sectors is different from the classification done for this PPP Monitor. The database maintained by the DEA, however, classifies the sector as “social and commercial infrastructure” and covers six subsectors: (i) cold chain, (ii) common infrastructure for industrial parks and special economic zones, (iii) education, (iv) healthcare, (v) post-harvest storage infrastructure for agriculture and horticulture produce including cold storage, and (vi) tourism. However, to align with the PPP Monitor’s definition of social infrastructure sector, only projects under the education and healthcare sectors are taken into consideration. The PPP database does not have any information on affordable housing nor on government building projects. Past PPP projects in the social infrastructure sector classified in terms of PPP variant or scheme, based on the DEA database, are shown in the table.
Number of Social Infrastructure Projects Across Public–Private Partnership Variants
Public–Private Partnership Variant No. of Projects Build–operate–transfer 37 Build–own–operate–manage 2 Build–own–operate–transfer 2 Design–build–finance–operate–transfer 2 Design–build–operate–transfer 2 Design–build–own–operate–transfer 2 Lease 2 Management contract (O&M with rehabilitation/expansion) 1 Management contract (O&M) 1 Total 51 O&M = operation and maintenance.
Note: Data was last updated on 5 December 2019.
Source: Government of India, Ministry of Finance, Department of Economic Affairs. List of Infrastructure Projects (accessed 15 July 2023).
Number of Social Infrastructure Projects Based on Subsectors
Subsector No. of Projects Education 37 Healthcare 14 Total 51 Note: Data was last updated on 5 December 2019.
Source: Government of India, Ministry of Finance, Department of Economic Affairs. List of Infrastructure Projects (accessed 15 July 2023).
Typical Risk Allocation for PPP Projects
COMPAREDOWNLOADRisk Type Private Public Shared Comment Land risk Design risk Construction risk Financing risk Cost recovery risk Offtake risk Trunk infrastructure risk - Yes
Social Infrastructure
Tariffs
No centrally available data.
Social Infrastructure
Challenges
Public Housing
The development of affordable housing presents several opportunities for improvement:
- The high cost of land is a key consideration. By ensuring more affordable land costs, value can be effectively transferred to the end users.
- Developers and builders often face challenges in financing land. Developing innovative financing solutions could greatly aid in the delivery of affordable housing.
- The absence of well-defined titles can limit the involvement of financial institutions and real estate developers in new and redevelopment projects. By improving title clarity, land can be better utilized, potentially easing land shortages and reducing land prices .
Education
Some of the opportunities for growth and development in India’s higher education sector are as follows:1
- The gross enrollment ratio of India in higher education is currently at 27.3%, which presents a significant opportunity to expand access to higher education.
- There is vast potential to improve the quality of education infrastructure facilities such as real estate, classrooms, libraries, hostels, furniture, sports facilities, transport, and commercial buildings. Private sector participation is critical for establishing colleges and in providing quality physical infrastructure.
- While faculty shortages have been a challenge, this opens opportunities to attract and retain well-qualified teachers, thereby enhancing the quality of education.
- The adoption of more rigorous quality standards in accreditation and branding activities can significantly elevate the reputation and credibility of India’s higher education institutions.
- 1Y. A. Sheikh. 2017. Higher Education in India: Challenges and Opportunities. Journal of Education and Practice. 8 (1). pp. 39–42.
Other Sectors
Contracting Agencies
The Ministry of Housing and Urban Affairs (MOHUA) is entrusted with the responsibility of broad policy formulation and monitoring of programs regarding urban housing and urban development. The MOHUA formulates the policies and strategies pertaining to various aspects of the water supply, sanitation, and solid waste management or municipal solid waste (MSW) sectors and provides technical and financial assistance to the states. The Central Public Health and Environmental Engineering Organisation is the MOHUA's technical wing. It deals with matters related to urban water supply and sanitation, including solid waste management.
Local governments and urban local bodies (ULBs) are the executing and contracting agencies for MSW projects and are responsible for solid waste management at the local level. The Government of India, through programs such as the Swachh Bharat Mission, provides financial support so that MSW programs and projects are implemented in an efficient and timely manner.
Besides the ULBs, states have specific responsibilities in solid waste management. These are summarized as follows:1
- The Secretary-in-Charge of the Urban Development Department (UDD) of the concerned state or union territory has the overall responsibility in implementing municipal solid waste management (MSWM) systems in cities and towns in line with MSW rules.
- The UDD is required to prepare a state policy and strategy for MSWM in the state.
- The UDD has to report to the Ministry of Urban Development on service-level benchmarks for MSW service provision in the ULBs.
- The UDD is also responsible for approval of land transfer from the state to the ULBs (for all projects).
- States have the power to regulate the creation of staff positions (technical and nontechnical) in the ULBs.
- The State Pollution Control Board is responsible for monitoring compliance with the MSWM plan and the MSW rules. It is also authorized to give environmental clearance to facilities listed in the Environmental Impact Assessment Notification, 2006.
- The power to authorize municipal authorities or operators to set up treatment and disposal facilities also lies with the State Pollution Control Board.
- 1Government of India, Ministry of Housing and Urban Affairs. 2016. Municipal Solid Waste Management Manual.
Other Sectors
Sector Laws and Regulations
- The sector is mainly governed by the Solid Waste Management Rules, 2016 (notified in 2018). These rules, notified by the Ministry of Environment, Forests and Climate Change, have replaced the Municipal Solid Wastes (Management and Handling) Rules, 2000, which had been in place for 16 years.
- The important regulations for the sector are provided in the table.
Applicable Regulations
Regulation Description Manual on MSWM, 2016 - Guidelines published by the MOHUA through the CPHEEO in 2016 for implementing all aspects of MSWM, including segregation, collection, transportation, treatment, and disposal.
Swachh Bharat Mission, 2014 - The SBM guidelines cover household toilets, community and public toilets, and solid waste management. Subsequently, SBM 2.0 was launched in 2021 to carry forward the progress from SBM 1.0 and go from ODF to ODF+ and ODF++ status. Cities and towns that are working toward ensuring sustainability of the ODF status to ensure proper maintenance of toilet facilities is called SBM ODF+. Safe collection, conveyance, treatment, and disposal of all fecal sludge and sewage is called SBM ODF++.
National Urban Sanitation Policy, 2008 - Broadly covers aspects of urban sanitation, with a specific focus on eliminating open defecation in cities and reorienting institutions for developing citywide approach to sanitation, covering all sanitation aspects including solid waste management.
Rules for special waste - Plastic Waste Management Rules, 2011 (revised in 2016 and amended in 2022)
- Bio-Medical Waste (Management and Handling) Rules, 1998 (amended in 2003 and 2011) and Bio-Medical Waste Management Rules, 2016
- E-Waste Management Rules, 2011 (revised in 2016)
- Battery (Management and Handling) Rules, 2001
Other relevant rules and task force reports - Interministerial Task Force on Integrated Plant and Nutrient Management Using City Compost, 2005
- Fertilizer Control Order, 2009; Phosphate Rich Organic Manure, 2013 by the Ministry of Agriculture
- Report of the Task Force on Waste to Energy, Planning Commission, 2014
Other relevant acts - Environment Protection Act,1986
- Hazardous and Other Wastes (Management and Transboundary Movement Rules, 2016)—for the control of hazardous waste
- Construction and Demolition Waste Management Rules, 2016—for waste generated from construction, remodeling, and repair and demolition of any civil structure
CPHEEO = Central Public Health and Environmental Engineering Organisation, MOHUA = Ministry of Housing and Urban Affairs, MSWM = municipal solid waste management, ODF = open defecation free, SBM = Swachh Bharat Mission.
Source: Government of India, Ministry of Housing and Urban Affairs. 2016. Municipal Solid Waste Management Manual.
Key Entities
Agency Function (Indicative List) Central Public Health and Environmental Engineering Organisation, Ministry of Housing and Urban Affairs Assists the Ministry of Housing and Urban Affairs in urban water supply and sanitation, including solid waste management. It plays a vital role in processing schemes for external funding agencies, including the World Bank, Japan Bank for International Cooperation, Asian Development Bank, other bilateral and multilateral funding agencies, and institutional financing such as the Life Insurance Corporation of India. Ministry of Environment, Forests and Climate Change Involved in framing the rules for managing and handling solid waste under the following acts: (i) Environment (Protection) Act, (ii) Water (Prevention and Control of Pollution) Act, (iii) Air (Prevention and Control of Pollution) Act, and (iv) Central Pollution Control Board. Ministry of New and Renewable Energy The Ministry of New and Renewable Energy supports municipal solid-waste-based power generation projects. Source: Asian Development Bank. 2019. Public–Private Partnership Monitor. Second Edition.
Foreign Investment Restrictions
Parameter 2021 2022 2023 Maximum allowed foreign ownership of equity in greenfield projects 100% 100% 100% Note: 100% foreign direct investment is allowed in urban infrastructure projects.
Standard Contracts
Parameter Availability What standardized contracts are available and used in the market? - PPP/concession agreement - Power purchase agreement - Long-term waste supply contract - Capacity take-or-pay contract - Transmission and use of system agreement - Performance-based operations and maintenance contract - Engineering, procurement, and construction contract - Yes
Source: Asian Development Bank. 2019. Public–Private Partnership Monitor. Second Edition.
Other Sectors
Sector Master Plan
Solid waste management is essentially a municipal function. Accordingly, the ULBs develop their MSWM systems and carefully access their requirements of tools, equipment, vehicles, and processing and disposal facilities in a way and at a pace that is locally doable, meets the long-term needs of the ULB, and is also financially sustainable. It is imperative to take stock of the situation and develop an MSWM plan. This plan should be in consonance with the MSW Rules, 2016, the state policy and strategy on MSWM, and the state sanitation strategy developed under the National Urban Sanitation Policy.
From a national perspective, the points below indicate the solid waste management sector’s potential:1
- India has the potential to generate approximately 3 GW of electricity from waste by 2050.
- The government allows 100% FDI under the automatic route for urban infrastructure areas, including waste management, subject to relevant rules and regulations.
- The central government has been implementing the Swachh Bharat Abhiyan, emphasizing waste management at different stages of generation, collection, and disposal.
- The MSW sector in India is projected to see a capital expenditure and an O&M requirement of about $65 billion (₹4.75 trillion) by 2030.
- India has the potential to generate approximately 90 million tons of waste per year by 2030–2032.
- High population growth because of changing lifestyles will increase the waste volumes in India.
- 1PR Newswire, Research and Markets. 2019. The Waste to Energy (WtE) and Waste Management Market in India, 2019–2025: High Population Growth and Changing Lifestyles to Increase Waste Volumes in India. 28 November.
Projects under Preparation and Procurement
Public–Private Partnership Municipal Solid Waste Projects under Preparation and Procurement
COMPAREDOWNLOADNotes:
1. The hyphen symbol (-) means data are not available.
2. Projects under conceptualization and development have been extracted from the India Investment Grid website. The website serves as a repository of a list of projects under the National Infrastructure Pipeline (NIP), which is constantly updated and provides attractive investment opportunities in projects. The website also features the non-NIP which includes additional project opportunities collated by the India Infrastructure Grid.
Source: Government of India, Ministry of Commerce and Industry, Department for Promotion of Industry and Internal Trade, India Investment Grid. Projects under NIP and Non-NIP (accessed 15 July 2023).
Other Sectors
Features of Past PPP Projects
Procurement of PPP Projects
Modes of Procurement for Public–Private Partnership Municipal Solid Waste Projects
COMPAREDOWNLOADNotes: Only active and concluded projects are considered in the graph. The hyphen symbol (-) means there are no projects in the sector, data are unavailable or not applicable, according to the database. Information on 12 projects (up to 2022) is either not available or not applicable, according to the database, and is therefore excluded.
Source: World Bank. Infrastructure Finance, PPPs and Guarantees. Custom Query (accessed 3 January 2024).
PPP Projects Reaching Financial Close
Public–Private Partnership Municipal Solid Waste Projects Reaching Financial Closure
COMPAREDOWNLOADPPP = public–private partnership.
Note: Only active and concluded projects are considered in the graph.
Source: World Bank. Infrastructure Finance, PPPs and Guarantees. Custom Query (accessed 3 January 2024).
PPP Projects with Foreign Sponsor Participation
Public–Private Partnership Municipal Solid Waste Projects with Foreign Sponsor Participation
COMPAREDOWNLOADPPP = public–private partnership.
Notes: Only active and concluded projects are considered in the graph. Information on three projects (1990–2022) is either partially available or not available and, hence, excluded.
Source: World Bank. Infrastructure Finance, PPPs and Guarantees. Custom Query (accessed 3 January 2024).
Government Support to PPP Projects
Government Support to Public–Private Partnership Municipal Solid Waste Projects
COMPAREDOWNLOADNotes: Only active and concluded projects are considered in the graph. The hyphen symbol (-) means there are no projects in the sector, data are unavailable or not applicable, according to the database.
Source: World Bank. Infrastructure Finance, PPPs and Guarantees. Custom Query (accessed 3 January 2024).
Payment Mechanism for PPP Projects
Payment Mechanisms for Public–Private Partnership Municipal Solid Waste Projects
COMPAREDOWNLOADNotes: Only active and concluded projects are considered in the graph. Information on two projects (up to 2020) is not applicable, according to the database, and is therefore excluded.
Source: World Bank. Infrastructure Finance, PPPs and Guarantees. Custom Query (accessed 3 January 2024).
Past PPP projects in the municipal solid waste sector classified in terms of PPP variant or scheme, based on the DEA database, are shown in the table.
Number of Municipal Solid Waste Projects Across Public–Private Partnership Variants
Public–Private Partnership Variant No. of Projects Build–operate–transfer 7 Build–operate–transfer (annuity) 2 Build–own–operate-transfer 23 Design–build–finance–operate 2 Design–build–finance–operate–transfer 10 Design–build–finance–operate–transfer (toll) 1 Design–build–operate–transfer 4 Design–build–own–operate–transfer 6 Not available 11 Service contract 4 Total 70 Note: Data was last updated on 5 December 2019.
Source: Government of India, Ministry of Finance, Department of Economic Affairs. List of all PPP Projects (accessed 15 July 2023).
Typical Risk Allocation for PPP Projects
Type of Risk Public Private Shared Delay in land acquisition Financing risk Approvals Design risk Construction risk Operation and maintenance risk Volume risk Payment risk Environmental, health, and safety risks Change in law risk Force majeure risk - Yes
LEARN MOREOther Sectors
Features of Past PPP Projects
The MOHUA, under the Swachh Bharat Mission, prepared a tool kit for contracting agencies and practitioners. It includes a risk allocation framework across various models for engaging private sector partners.
Risk Allocation Matrix for Variants
Type of Risk Risk Allocation Service Contract Management Contract BOT/Concession Design risk ULB and/or state agency Private developer Private developer Construction risk To be borne by both parties in accordance with the provision To be borne by the private developer other than the asset transfer delay Operation risk To be borne by the private developer other than the change in scope of the project by the ULB and/ or state agency Revenue risk ULB and/or state agency Partly by ULB and the private player in accordance with the provision of the contract Financial risk ULB and/or state agency Private developer Private developer Environmental risk ULB and/or state agency Private developer other than the preexisting environmental liability to be taken care by ULB and/or state agency Force majeure risk Additional cost to rectify resulting in increased cost of operation, time overrun, nonachievement of service levels To be borne by the parties in accordance with the provisions of the contract Insurance risk Financial loss To be borne by the private developer in accordance with the provisions of the contract BOT = build–operate–transfer, ULB = urban local body.
Source: Government of India, Ministry of Housing and Urban Affairs. Toolkit for Public Private Partnership Frameworks in Municipal Solid Waste Management (accessed 30 August 2020).
Sources: Asian Development Bank. 2019. Public–Private Partnership Monitor. Second Edition; and Government of India, Ministry of Finance, Department of Economic Affairs. Public Private Partnership in India (accessed 15 July 2023).
Financing Details
Parameter 1990–2021 1990–2022 1990–2023 PPP projects with foreign lending participation UA UA UA PPP projects that received export credit agency/international financing institution support UA UA UA Typical debt:equity ratio 60:40 Time for financial close UA Typical concession period 15–30 years Typical financial internal rate of return UA PPP = public–private partnership, UA = unavailable.
Source: World Bank. Infrastructure Finance, PPPs and Guarantees. Custom Query (accessed 3 January 2024).
Other Sectors
Tariffs
Data unavailable.
Other Sectors
Challenges
The successful execution of MSW projects could be enhanced by addressing the following areas:
- ULBs could benefit from increased knowledge and institutional abilities in managing solid waste, including recycling, reuse, and energy recovery. This would enable them to formulate more effective plans for solid waste management.
- There is potential for growth in the capacity to conceive and structure projects with suitable risk allocation, and to manage private sector operators more effectively.
- Greater cooperation from citizens in supporting solid waste management, such as proper waste segregation (wet and dry, recyclable), could reduce operational costs for the operator and enhance the effective use of the collected waste.
- Providing sufficient land in suitable locations would make it easier for the private operator to execute the project, enhancing the overall efficiency of MSW projects.
Social Infrastructure
Govt. Expenditure on Education (% of GDP)
Education Spending (% of govt. spending)
Total Health Expenditure
Health Spending per Capita
FC = financial closure, GDP = gross domestic product, Govt. = government.
Sources: World Bank. Total Adult Literacy Rate (% of people ages 15 and above) (accessed 15 July 2023); World Bank. Total Government Expenditure on Education (% of GDP) - India (accessed 15 July 2023); World Bank. Current Health Expenditure (% of GDP) - India (accessed 15 July 2023); World Bank. Primary School Enrollment (% gross) – India (accessed 15 July 2023); and Government of India, Ministry of Health and Family Welfare, Press Information Bureau. 2022. Significant Decline in the Maternal Mortality Ratio (MMR) from 130 in 2014-16 to 97 per lakh live births in 2018-20. Press release. 30 November.
The social infrastructure sector in India includes healthcare (primary, secondary, and tertiary), education (primary, secondary, higher secondary, higher), and public housing. India’s distinct demographic advantage of having a large working population can be maximized by providing adequate social infrastructure in sectors like education, healthcare, water supply, sanitation, and housing.